Hi all, I'm new in the comunity and I used r for a while.
I'm trying to get a plot using ggplot. My question is simple and for this I don't explain tin depth the composition of the database.
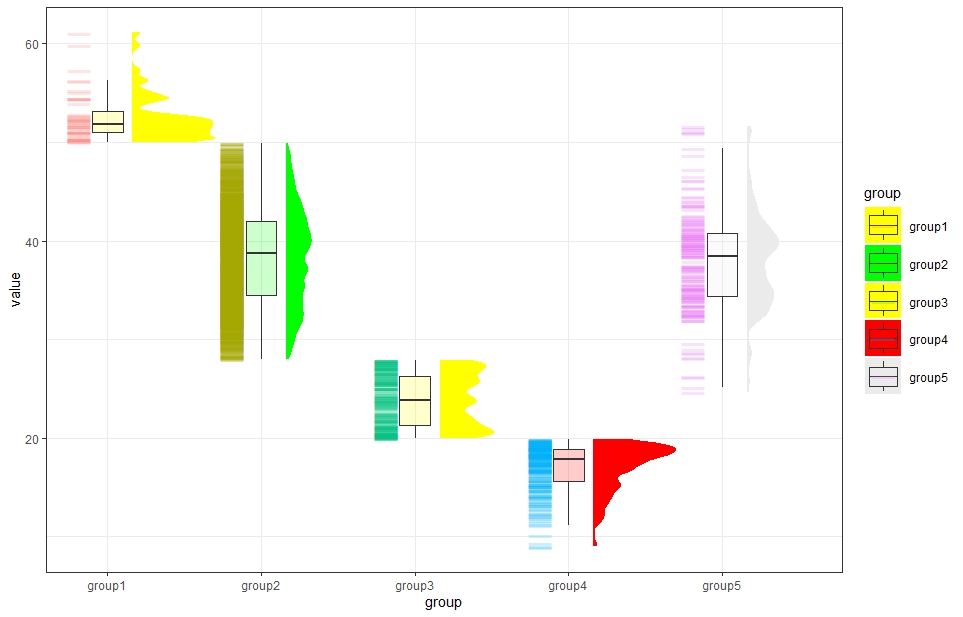
I have 5 different group in the DB and I need to color the plot using different and specific color for each group. I was able to get the plot attached vut as you can see the distribution and the box plot are in the right color but the third representation is different. Below my code....How can I get the same color in all the three representation according to the group? Where is the error? Thanks in advance!
group.colors <- c( group1="yellow", group2 ="green", group3 = "yellow", group4="red", group5="grey92")

ggplot(data, aes(x= group, y = value, fill=group)) +
  ggdist::stat_halfeye(
    #fill="gray",
    adjust = .5,
    width = .6,
    .width = 0,
    justification = -.3,
    point_colour = NA) +
  geom_boxplot(
     width = .2,
    outlier.shape = NA,
    alpha = .2,
  ) +
  gghalves::geom_half_point(aes(color=group),
                            ## draw bar codes on the left
                            side = "1",
                            ## draw horizontal lines instead of points
                            shape = 95,
                            ## remove jitter along x axis
                            range_scale = 0,
                            size = 10,
                            alpha = .2
  ) +
  theme_bw() +
  coord_cartesian(xlim = c(1.2, NA), clip = "off") +
  scale_fill_manual(values=group.colors)