Hi,
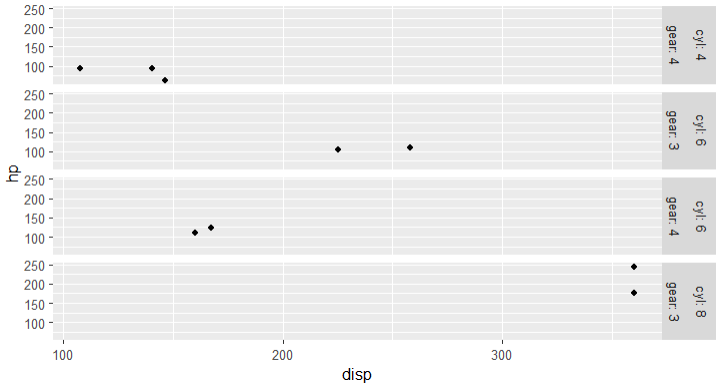
have a plot in which I used the facet_grid function. In that plot, I have titles and units together.
I want to separate the title and unit, or I want to create another strip for the units along with title strip.
So, one strip for the title and one strip for units
I hope I am clear on my point.
My code is
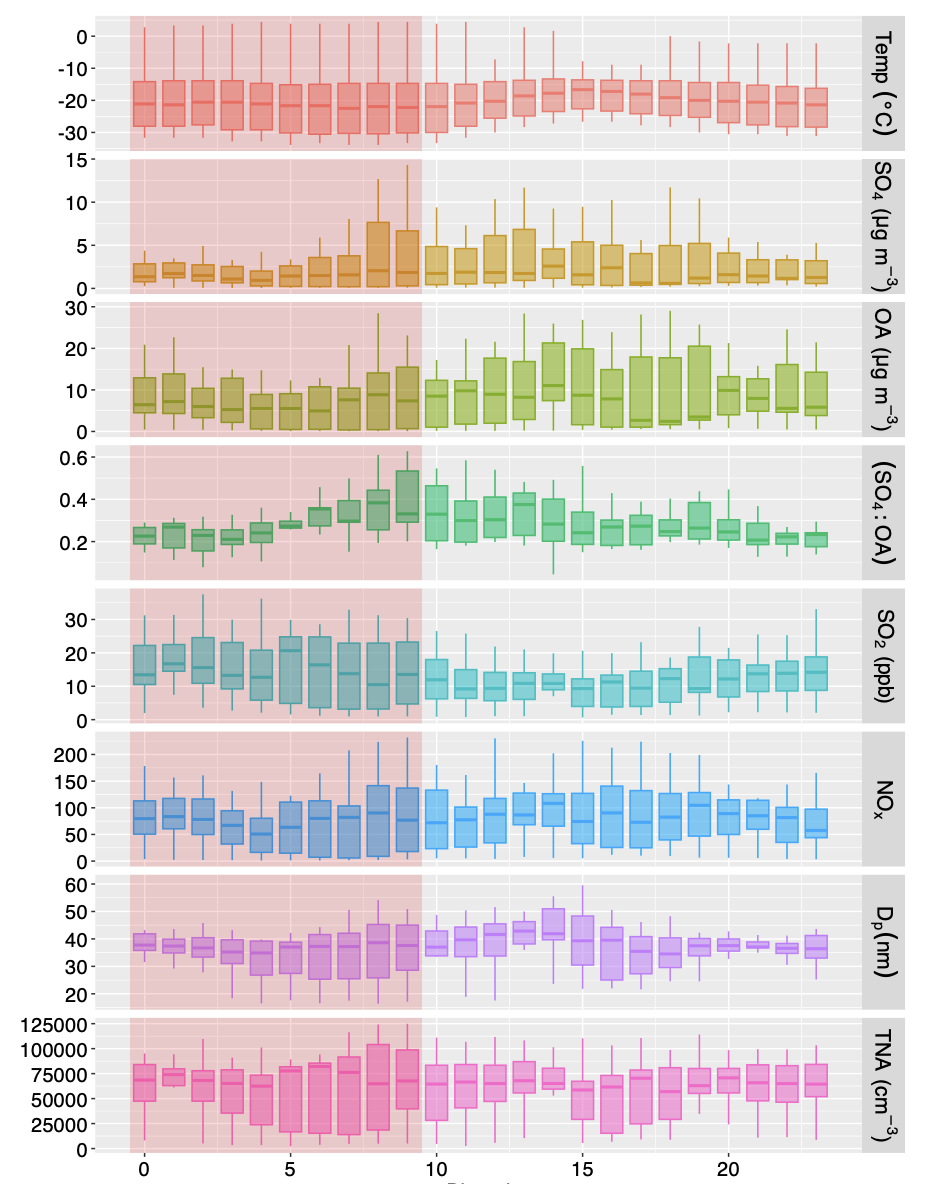
levels(BOX_HOURLY$variable) <- c( expression(Temp ~ (degree*C)) ,
"SO[4] ~ '('*mu*g~m^-3*')'",
"OA ~ '('*mu*g~m^-3*')'",
"(SO[4]: OA)",
"SO[2] ~ '('*ppb*')'","NO[x]",
"D[p](nm)",
"TNA ~ '('*cm^-3*')'")
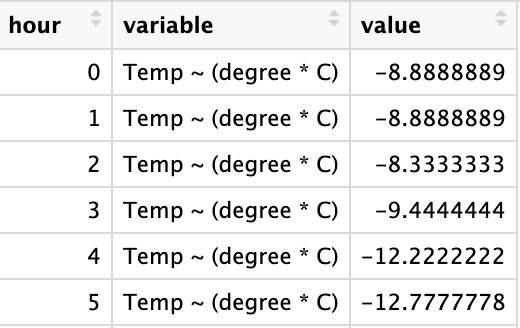
BOX_HOURLY %>%
ggplot(aes(x=hour, y=value, color=variable, group = hour, fill = variable,alpha=0.2)) +
geom_boxplot(notch = F,outlier.shape = NA) +
ylab("")+
xlab("")+
theme(legend.position="none")+
theme(legend.title=element_blank())+
theme(legend.text=element_text(size=12)) +
theme(axis.title = element_text(face="plain",size=14,color="black"),
axis.text=element_text(size=14,face="plain", color="black"),
axis.text.x=element_text(hjust=0.5),
plot.title = element_text(size=15))+
theme(strip.text = element_text(size=15, color="black"))+
facet_grid(variable ~., switch = "x", scales = "free", space = "free_x",
labeller = label_parsed)+
annotate("rect", fill = "red", alpha = 0.15,
xmin = -0.5,
xmax = 9.5,
ymin = -Inf,
ymax = Inf)