I'm creating a plot where I want the X axis to extend to 90 (days) for 3 out of 4 facets, but only 30 on the final facet. I can use different limits with scales = "free_x", but the default axis breaks don't specify the end point for each facet, which is problematic for us.
I can specify breaks manually and they look great on 3/4 facets, but result in not-great breaks on the final facet:

I know it should be possible to pass a function to the breaks argument, but are there examples out there that would work for my use case? I haven't been able to get one to work.
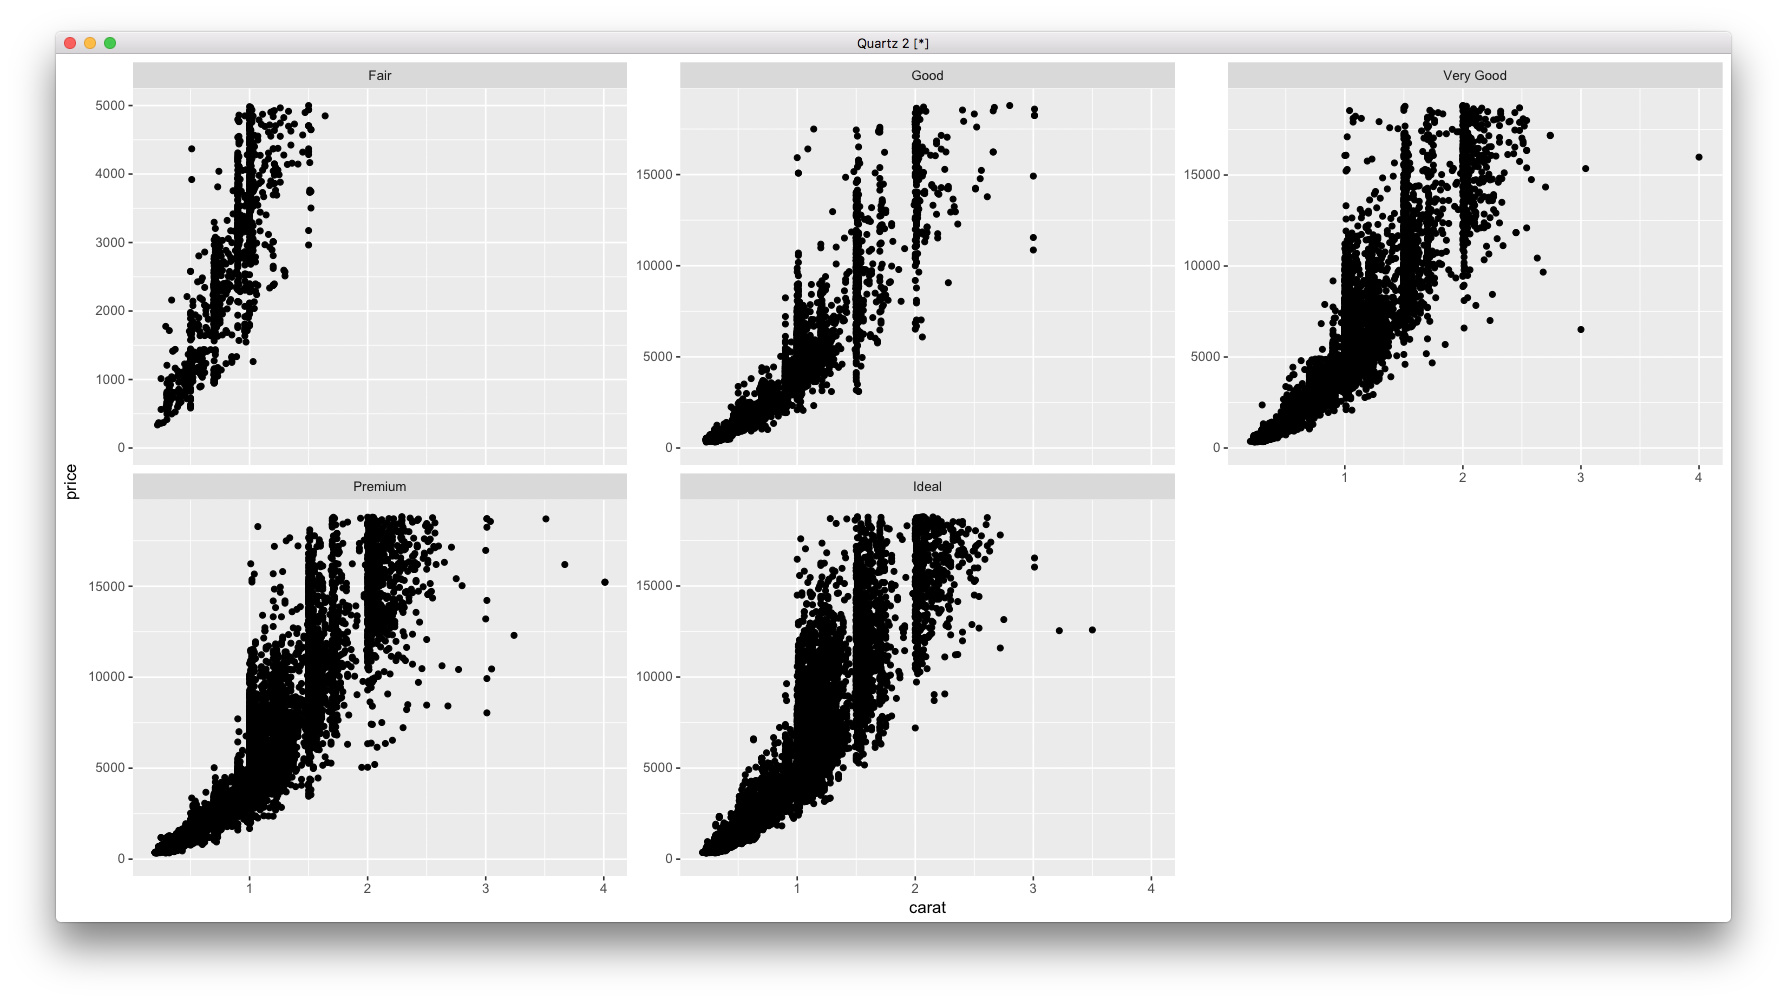
Using this example ![]() , what I'd like to do is along the lines of setting Y axis breaks at
, what I'd like to do is along the lines of setting Y axis breaks at seq(0, 5000, 1000) for the first panel, and specifying that every other panel has axis breaks every $5000.
diamonds2 <- subset(diamonds, !(cut == "Fair" & price > 5000))

ggplot2::ggplot(data = diamonds2, aes(x = carat, y = price)) +
  facet_wrap(~ cut, scales = "free_y") +
  geom_point() +
  scale_y_continuous(breaks = seq(0, 15000, 5000))
    ## but how to make more flexible for Fair panel?
Ideally, I would use either breaks = 7 (for 7 breakpoints), or a function along the lines of breaks = ~ seq(min(facet_subset$time), max(facet_subset$time), length.out = 7). Is something like this possible? (breaks = 7, of course, gives me a single break point at 7!)
I've considered giving up and just creating four separate plots and patching them together (and will if I have to), but would really like to take advantage of the shared axis titles available with facets. Thanks for any ideas!