Hi there,
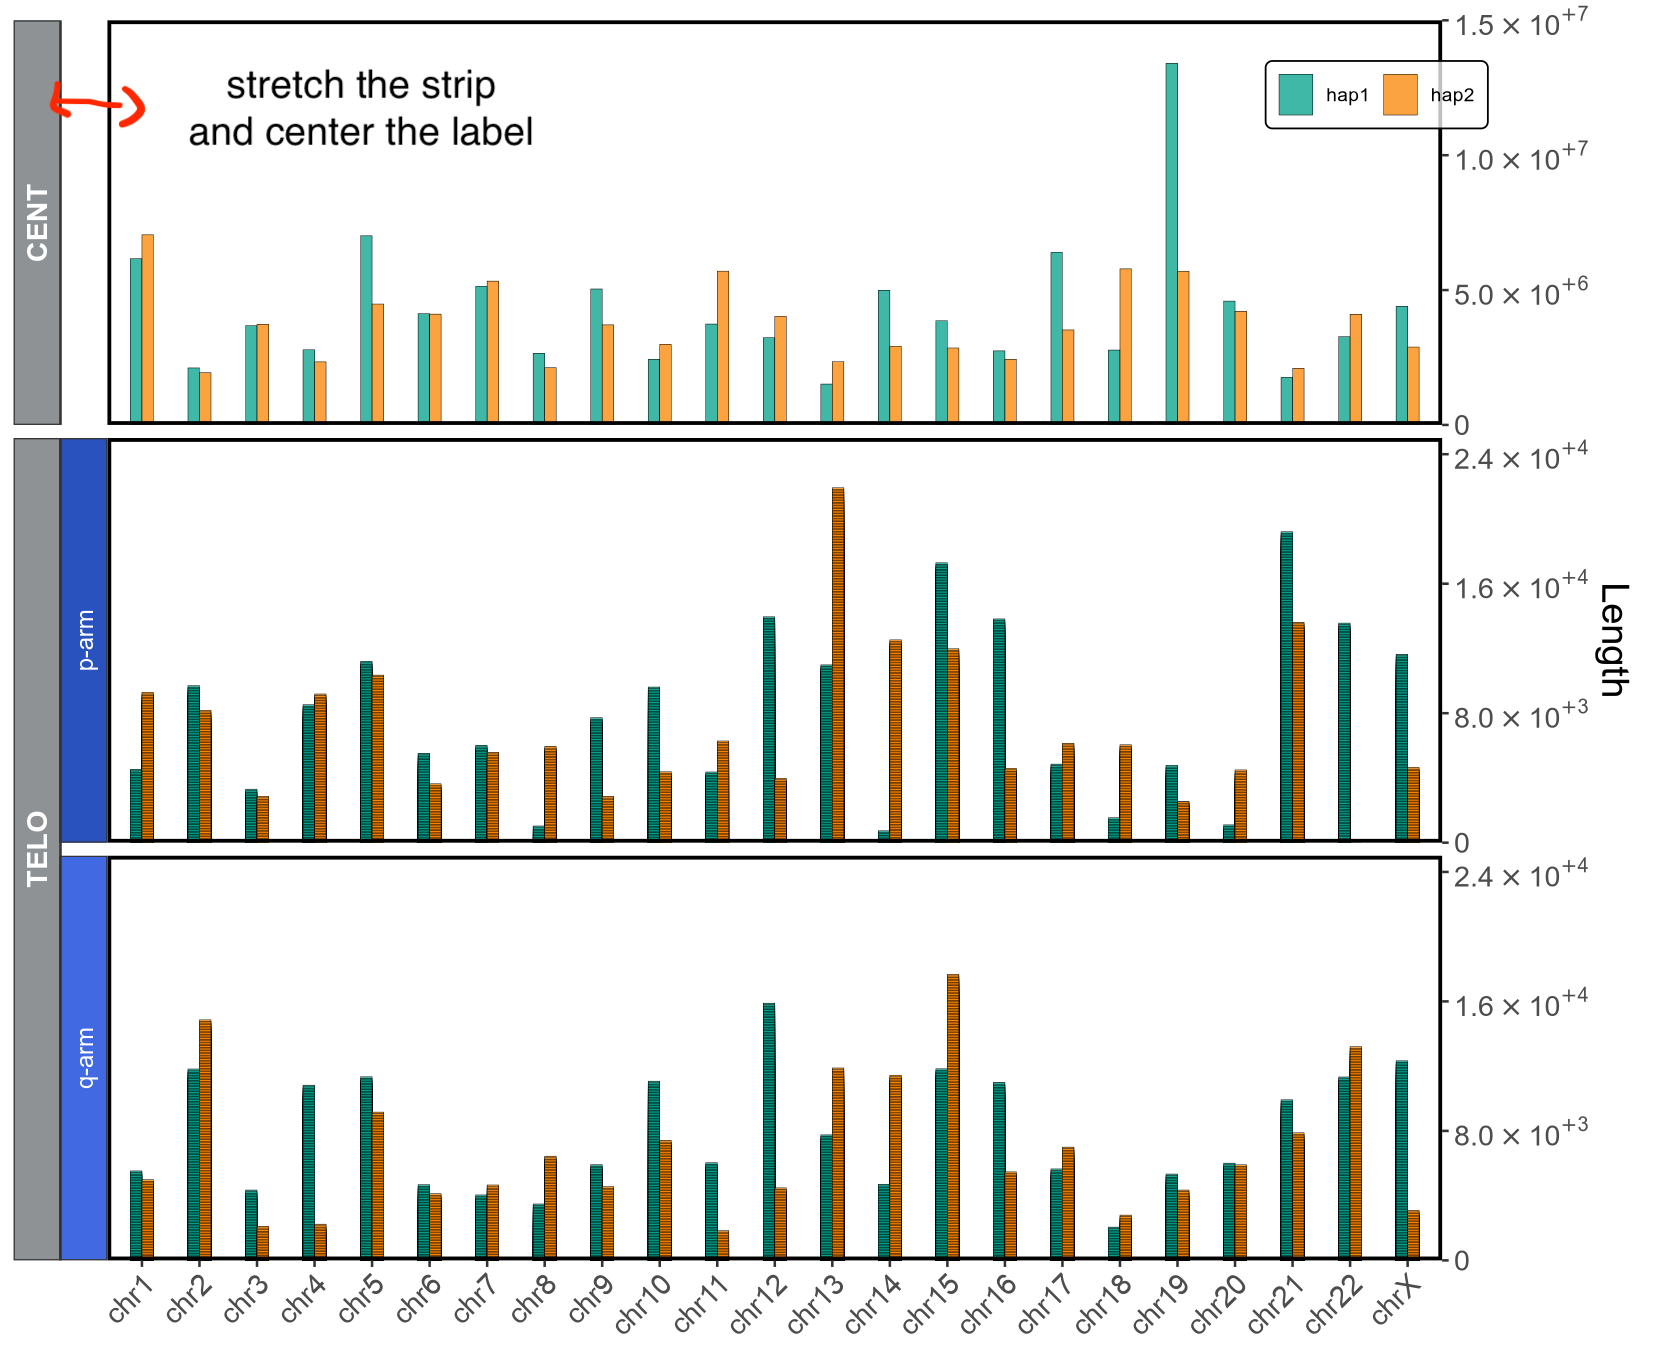
I'm working on a plot using nested facets. One of the elements (CENT) does not have a second layer though, so I wish for it to have a strip that span the entire width of the other element (TELO). Below the code I'm using:
library(ggh4x)
library(scales)
library(ggplot2)
library(extrafont)
library(paletteer)
library(elementalist)

t_col <- function(color, percent = 75, name = NULL) {
  rgb.val <- col2rgb(color)

  t.col <- rgb(rgb.val[1], rgb.val[2], rgb.val[3],
               max = 255,
               alpha = (100 - percent) * 255 / 100,
               names = name)

  invisible(t.col)
}
legend_fill <- t_col("white", perc=25, name="lt.fill")
fancy_scientific <- function(l) {
  l <- format(l, scientific = TRUE)
  l <- gsub("^(.*)e", "'\\1'e", l)
  l <- gsub("e", "%*%10^", l)
  parse(text=l)
}

strips_2 <- strip_nested(

  background_y = list(element_rect(fill="#8e9295"),
                      element_rect(fill="#8e9295"),
                      element_blank(),
                      element_rect(fill="#2a52be"),
                      element_rect("#4169e1")),
  text_y = list(element_text(face="bold", color="white", size=12),
                element_text(face="bold", color="white", size=12),
                element_blank(),
                element_text(color="white", size=10),
                element_text(color="white", size=10)),
  by_layer_y = FALSE

)

my_palette <- paletteer_d("wesanderson::Darjeeling1")[c(2,4)]

facet_both <- ggplot(all, aes(fill=HAP, x=CHR, y=`Length`)) +
  geom_col(position="dodge", width=.4, alpha=.75, color="black", linewidth=0.1) +
  theme_bw() + facet_nested_wrap(~REG + ARM, ncol=1, dir="h", strip=strips_2, strip.position="left", scales="free_y") +
  theme(legend.box.background=element_rect_round(color="black",
                                                 fill=legend_fill,
                                                 linetype="solid",
                                                 radius=unit(1,"mm")),
        legend.background=element_rect(fill="transparent"),
        legend.position.inside=c(0.951,0.94), legend.box='horizontal',
        text=element_text(family="Arial"), panel.grid=element_blank(), legend.title=element_blank(),
        axis.text=element_text(size=12), axis.text.x=element_text(angle=45, hjust = 1), axis.title.x=element_blank(),
        axis.title.y=element_text(size=16), legend.text=element_text(size=8), plot.margin=unit(c(.3, .5, .2, .2), "cm"),
        panel.border = element_rect(colour="black", fill=NA, linewidth=1.5)
  ) +
  guides(fill=guide_legend(ncol=2, keywidth=1, position="inside")) + scale_fill_manual(values=(my_palette)) +
  scale_y_continuous(labels=function(x) ifelse(x == 0, "0", fancy_scientific(x)), limits=c(0, NA), expand=c(0, 0), position="right")
facet_both + facetted_pos_scales(
  y = list(
    REG == "CENT" ~ scale_y_continuous(labels=function(x) ifelse(x == 0, "0", fancy_scientific(x)), limits=c(0, 1.5e+07), expand=c(0, 0), position="right"),
    REG == "TELO" ~ scale_y_continuous(labels=function(x) ifelse(x == 0, "0", fancy_scientific(x)), limits=c(0, 25000), expand=c(0, 0), position="right",
                                       breaks=c(0, 8000, 16000, 24000))
  )
)
and this is the associated plot. I managed to remove the backgorund and text from that specific strip but I need to stretch the one for CENT to match the width of TELO. I've seen it should be possible with labeller but I do not quite get how... thanks in advance!
EDIT
Adding head() and tail() of the df all for clarity:
> head(all)
# A tibble: 6 × 5
  HAP   CHR   Length REG   ARM
  <chr> <fct>  <dbl> <chr> <chr>
1 hap1  chr1    4535 TELO  p-arm
2 hap1  chr1    4435 TELO  p-arm
3 hap1  chr1    4335 TELO  p-arm
4 hap1  chr1    4235 TELO  p-arm
5 hap1  chr1    4135 TELO  p-arm
6 hap1  chr1    4035 TELO  p-arm
> tail(all)
# A tibble: 6 × 5
  HAP   CHR    Length REG   ARM
  <chr> <fct>   <dbl> <chr> <chr>
1 hap1  chr21 1761195 CENT  NA
2 hap2  chr21 2093093 CENT  NA
3 hap1  chr22 3272138 CENT  NA
4 hap2  chr22 4103205 CENT  NA
5 hap1  chrX  4394450 CENT  NA
6 hap2  chrX  2887908 CENT  NA