My data is formatted as follows: date, wd, ws, PM10
The date is in 5 min increments from 29/06/2021-29/06/2022.
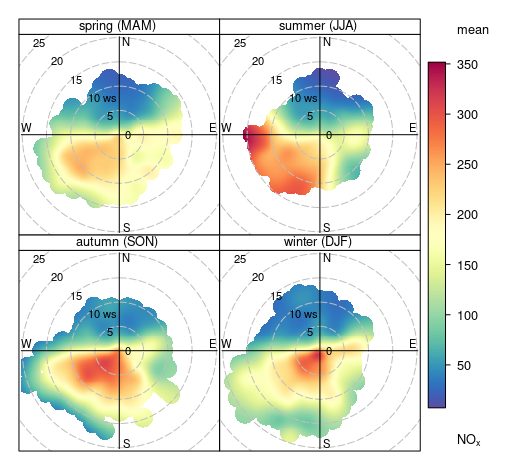
I'm trying to produce a plot like this:
I have tried the following code but it doesn't seem to get the result I'm looking for
polarPlot(openair::TabulatedDataReport_Jun292021700AM_Jun292022700AM_WNW_calenderplot, pollutant = "PM10", type = "season")
Is anyone able to assist?