Scatterplot with just one variable

Usually, a scatterplot requires a data column for the x and one for the y column, as for example here:

Now lets suppose I have this example:

library(ggplot2)

Fruit<-c("Banana", "Apple", "Banana", "Apple", "Apple")
Value<-c(50,75,80,60,30) #cents
Price<-c(1,2,1,3,1)     #euros
Fruits<-data.frame(Fruit, Value, Price)

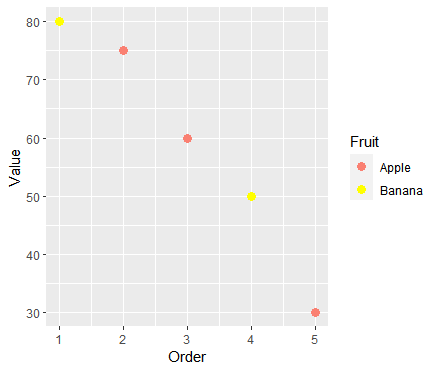
Now I do not want a scatterplot that corresponds for example the value to the price, I want just the value plotted, in descending order. The points would be (1,80), (2,75), (3,60), (4,50), (5,30). I then would like the color of the points changed depending on the type of fruit.

The coloring can be done with the examples in

for example, however, how do I plot just the one variable? I would like to avoid adding an artifical variable to my dataframe.

Fruits |> ggplot(aes(Fruit,Value)) + geom_point()

Thank you for your answer. That is not quite what I am after, the points created basically are (Banana, 80), (Apple, 75), (Apple, 60), (Banana, 50) and (Apple, 30), not (1,80), (2,75), (3,60), (4,50), (5,30) and a different color encoding which one is a banana or apple.

Hey! Have you tried this?

Fruits |> ggplot(aes(Fruit,Value)) + geom_point(aes(color=Fruit))

This way fruit types are represented by different colours.

Like this?

Fruits_sorted = Fruits %>% 
  arrange(desc(Value)) %>% 
  mutate(Order = 1:n() )

ggplot(Fruits_sorted, aes(x = Order, y = Value,
                   colour = Fruit)) +
  geom_point(size = 3) + 
  scale_color_manual(values = c("Banana" = "yellow",
                                "Apple" = "salmon"))

grafik

Edit: using the rank-function for defining the order would be more convenient. :wink:

1 Like

Thank you very much! It does introduce a new variable to the dataframe, but I suppose that is fine. :slight_smile:

I am not sure what you mean. The new data frame Fruits_sorted has a new variable but Fruits is unchanged. If you want to avoid the new data frame, just put all the steps in one pipe (I took Matthais' suggestion and used the rank() function from base R):

Fruits %>% 
  mutate(Order = rank(-Value)) %>%
  ggplot(aes(x = Order, y = Value, colour = Fruit)) +
  geom_point(size = 3) + 
  scale_color_manual(values = c("Banana" = "yellow",
                                "Apple" = "salmon"))

This topic was automatically closed 42 days after the last reply. New replies are no longer allowed.

If you have a query related to it or one of the replies, start a new topic and refer back with a link.