Hello everybody,
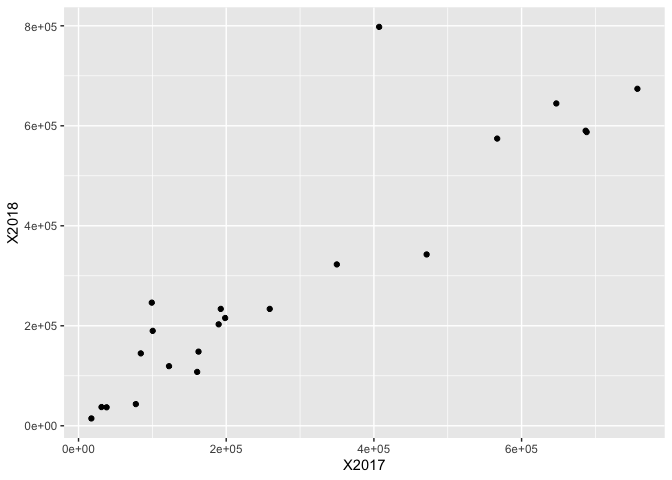
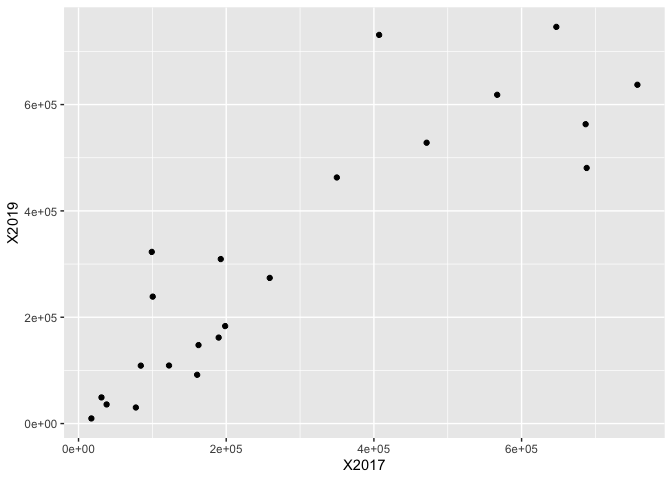
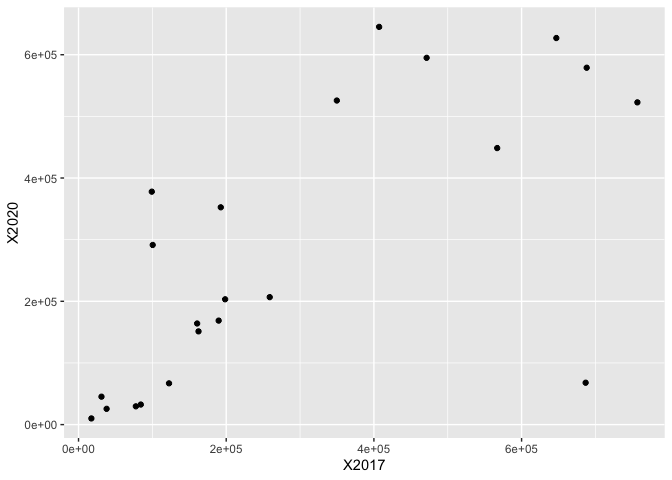
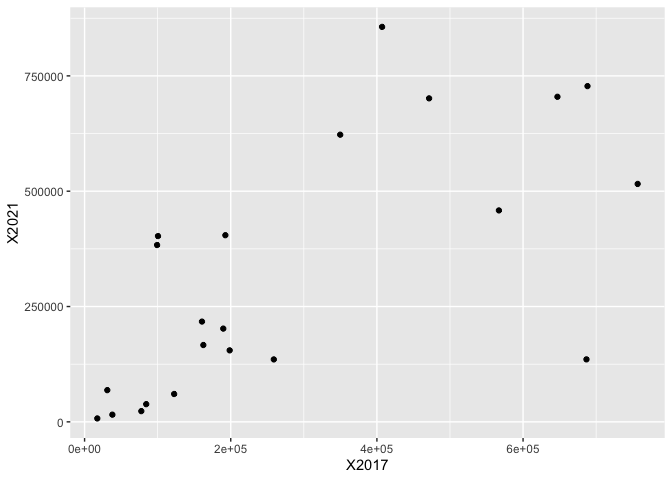
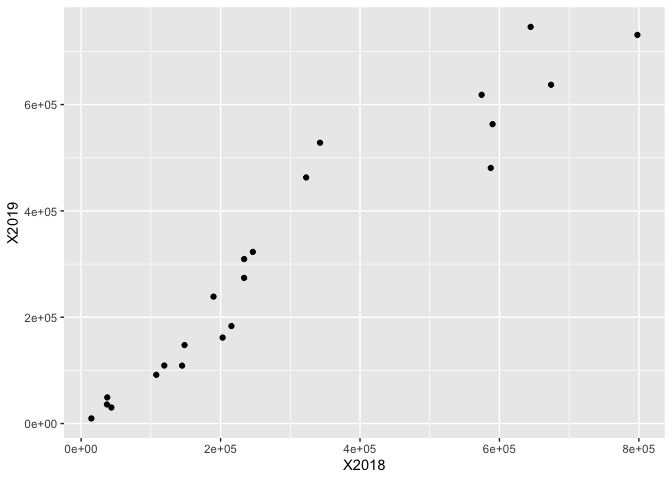
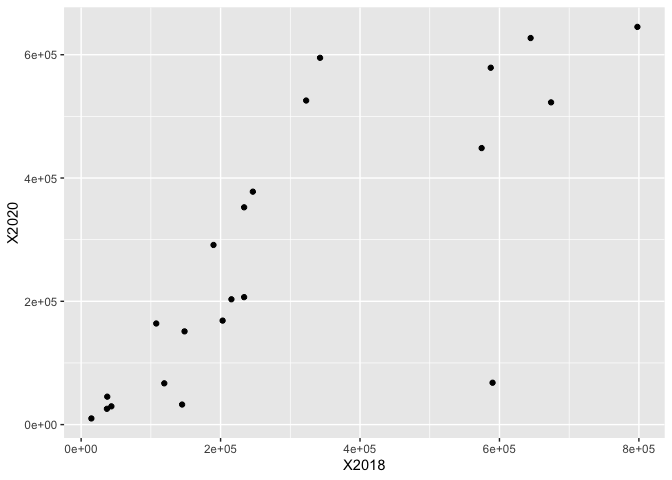
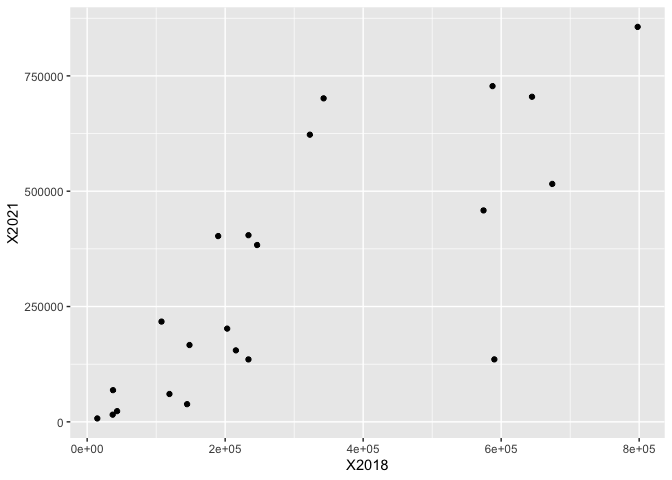
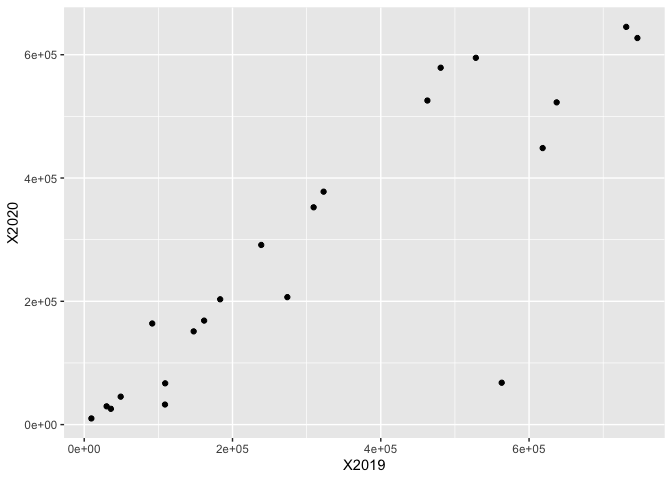
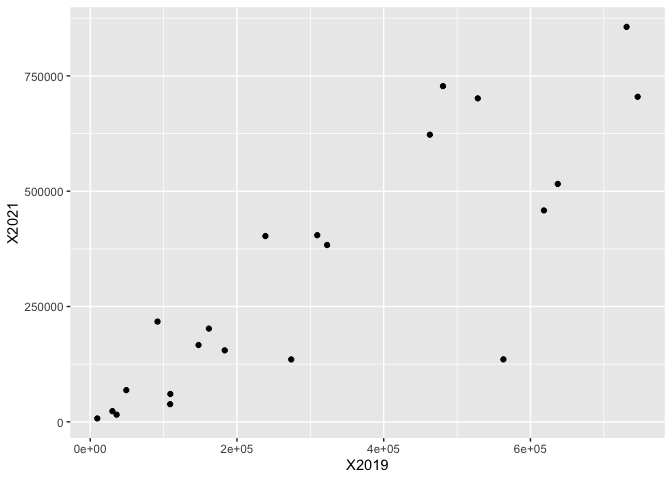
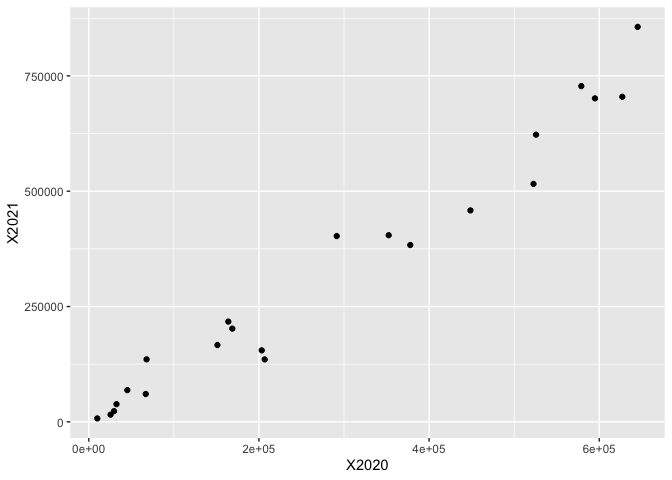
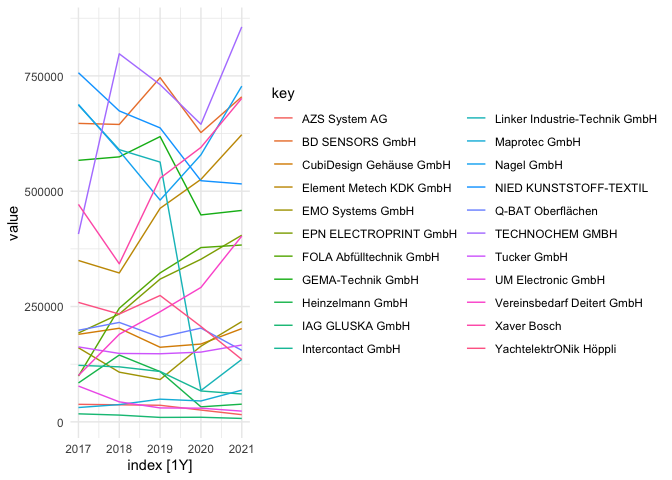
as a final challenge, I want to create a scatterplot of the dataset below, with Companies as x and the corresponding values as y. I found the ideal example code of the iris dataset based on dplyr and tidyr:
exampleData <-
iris %>%
filter(Species == "setosa") %>%
slice(1:10) %>%
select(Sepal.Length:Petal.Length)
exampleData
toPlot <-
exampleData %>%
gather(sepalMeasure, size, -Petal.Length)
toPlot %>%
ggplot(aes(x = Petal.Length
, y = size
, col = sepalMeasure)) +
geom_point()
I´m desperately trying to adjust the code, but I just don´t get it fixed without any help.
Thank you already for any advice and support!!
data.frame(
stringsAsFactors = FALSE,
Company = c("NIED KUNSTSTOFF-TEXTIL",
"Nagel GmbH","BD SENSORS GmbH","TECHNOCHEM GMBH",
"Xaver Bosch","GEMA-Technik GmbH","Linker Industrie-Technik GmbH",
"Element Metech KDK GmbH","Heinzelmann GmbH",
"Intercontact GmbH","IAG GLUSKA GmbH ","AZS System AG",
"UM Electronic GmbH","Maprotec GmbH",
"CubiDesign Gehäuse GmbH","Q-BAT Oberflächen","Tucker GmbH","EMO Systems GmbH",
"EPN ELECTROPRINT GmbH","FOLA Abfülltechnik GmbH",
"YachtelektrONik Höppli","Vereinsbedarf Deitert GmbH"),
X2017 = c(756823,688146,647021,407077,
471399,566944,686736,349779,84330,122540,17397,
38019,77618,31067,189772,198546,162485,160636,192630,
99207,258933,100464),
X2018 = c(674026,587493,644712,797846,
342685,574444,590111,322751,144808,119248,14684,
36982,43380,37444,202914,215543,148313,107733,
233774,246281,233752,189849),
X2019 = c(637241,480784,746121,731033,
528222,618359,563104,462867,108934,109194,9647,
35960,30213,49179,161728,183365,147625,91725,309424,
322866,273941,238745),
X2020 = c(522727,578899,627080,645161,
594989,448580,67919,525696,32547,66967,9998,25591,
29635,45296,168686,203288,151228,164011,352489,
377846,206766,291408),
X2021 = c(515765,727793,704699,856202,
701297,458338,135450,622501,38381,60398,7414,
15591,23253,68760,202138,154995,166553,217375,404617,
383349,135356,402740)
)