Suppose I have some data like this:
| group | element1 | element2 | element3 | element4 | |
| 1 | 9 | 7 | 4 | 4 | |
| 1 | 7 | 5 | 3 | 6 | |
| 1 | 6 | 11 | 2 | 8 | |
| 2 | 5 | 5 | 7 | 6 | |
| 2 | 2 | 7 | 10 | 7 | |
| 2 | 4 | 8 | 5 | 4 | |
| 3 | 7 | 4 | 6 | 8 | |
| 3 | 8 | 6 | 8 | 6 | |
| 3 | 6 | 9 | 3 | 5 |
I want to draw a heatmap to see the relationship between different elements (and different groups). But different elements may have different units, such as kg, mg, m, s and so on. So I have to scale the data before drawing. Also, I want to use the average of every element data in a group, just like mean(9, 7, 6)=22/3 in group 1.
Then I'm confused whether I should [1] scale all the data before average, or [2] average before scale.
I tried these two methods, here is my code:
ori_data <- read.csv("ori_data.csv")
################                             ################
###                      scale first                     ####
################                             ################

# scale
m1_scaled_element <- scale(ori_data[,2:ncol(ori_data)])
m1_scaled_data <- data.frame(group = ori_data$group, element = m1_scaled_element)

# mean
m1_result <- aggregate(. ~ group, data = m1_scaled_data, mean)

m1 <- data.frame(m1_result[,2:ncol(m1_result)], row.names = m1_result$group)
colnames(m1) <- colnames(ori_data)[2:ncol(ori_data)]

################                             ################
###                    mean then scale                   ####
################                             ################

# mean by group
m2_mean_element <- aggregate(. ~ group, data = ori_data, mean)
# then scale
m2_scaled_mean_element <- scale(m2_mean_element[,2:ncol(m2_mean_element)])
m2 <- data.frame(element1 = m2_scaled_mean_element, row.names = m2_mean_element$group )
colnames(m2) <- colnames(ori_data)[2:ncol(ori_data)]
# draw heatmap
library(pheatmap)
pheatmap(m1, fontsize = 15)
pheatmap(m2, fontsize = 15)
The result for [1]:
| group | element1 | element2 | element3 | element4 |
| 1 | 0.6285394 | 0.3527668 | -0.8819171 | 0.0000000 |
| 2 | -1.0999439 | -0.1007905 | 0.7559289 | -0.2222222 |
| 3 | 0.4714045 | -0.2519763 | 0.1259882 | 0.2222222 |
And the result for [2]:
| group | element1 | element2 | element3 | element4 |
| 1 | 0.6575959 | 1.1208971 | -1.0674900 | 0 |
| 2 | -1.1507929 | -0.3202563 | 0.9149914 | -1 |
| 3 | 0.4931970 | -0.8006408 | 0.1524986 | 1 |
Also the heatmap:
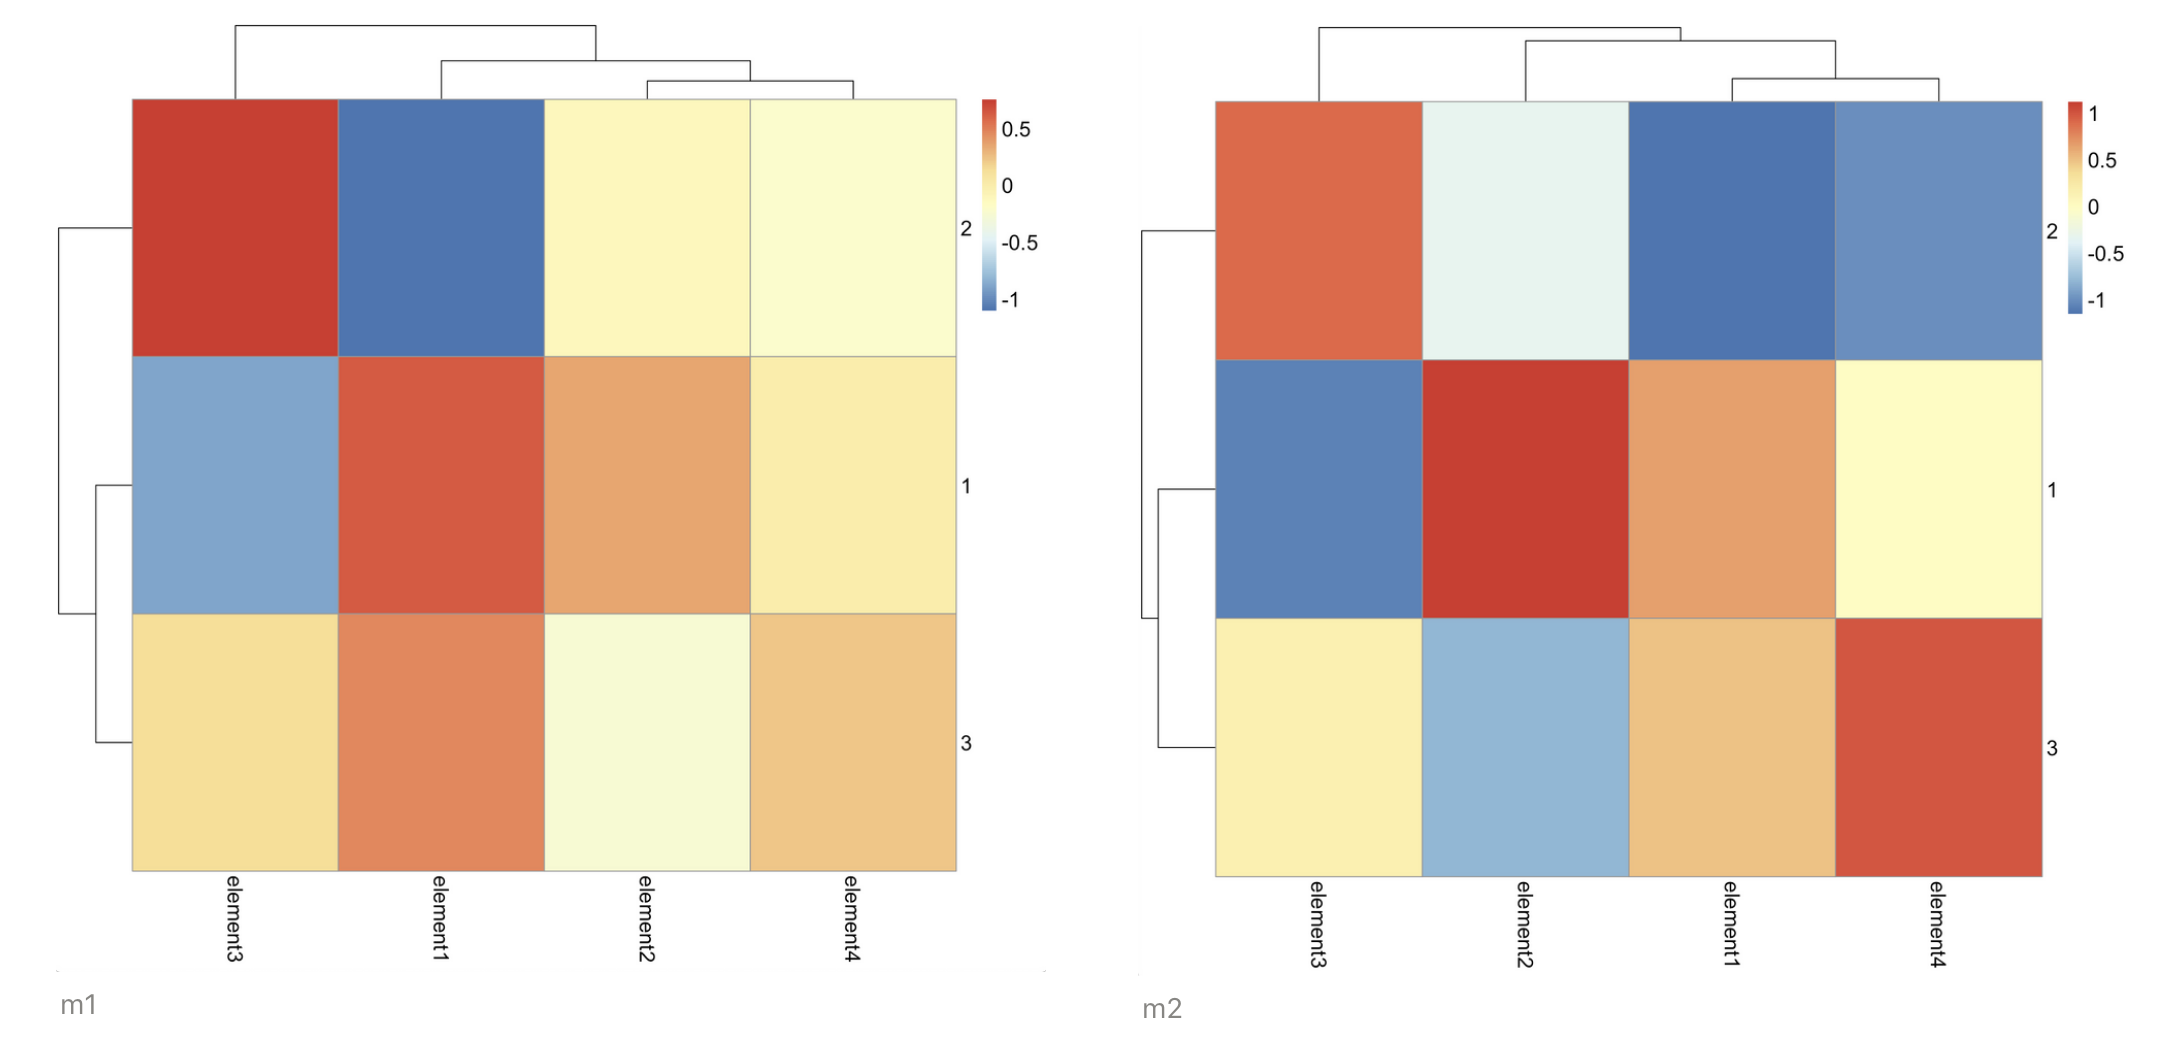
It does look different.
I feel that method 1 is better but I don't know how to explain it, could anyone tell me or give some reference?
Last but not least, thank you for reading to the end.
Thank You!