Hi folks!
I'd like to plot some measures that have been standardized to z-scores. I want the size of the point in geom_point() to increase from 0 to 3, and also to increase from 0 to -3. I also want the colour to change from red, to blue. The trick is to get both to work together.
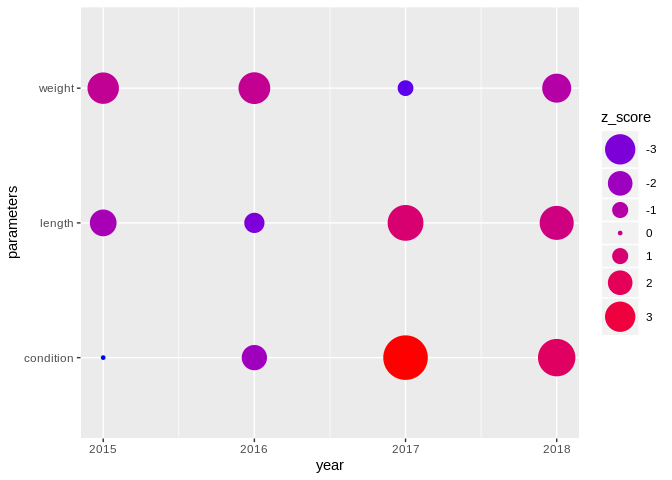
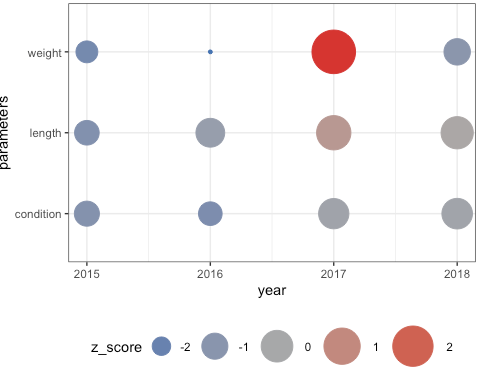
Here is an example that's as close as I can get to what I'd like, note that the size of the point increases from -2, whereas I want the size of the point to increase as the z_score moves away from zero.
library(tidyverse)

year <- rep(c(2015:2018), each = 3)
parameters <- rep(c("length", "weight", "condition"), 4)
z_score <- runif(12, min = -3, max = 3)
df <- tibble(year, parameters, z_score)

cols <- c("#d73027",
          "darkgrey",
          "#4575b4")

ggplot(df, aes(year, parameters, colour = z_score, size = z_score)) +
  geom_point() +
  scale_colour_gradientn(colours = cols) +
  theme(legend.position="bottom") +
  scale_size(range = c(1,15)) +
  guides(color= guide_legend(), size=guide_legend())
One trick I tried was to use the absolute value of z_score which scaled the points correctly but messed up the legend.
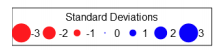
Here's what I'd like the legend and points size to be scaled to, though I'd like the colour to be a gradient as in my example. Any insight would be greatly appreciated!