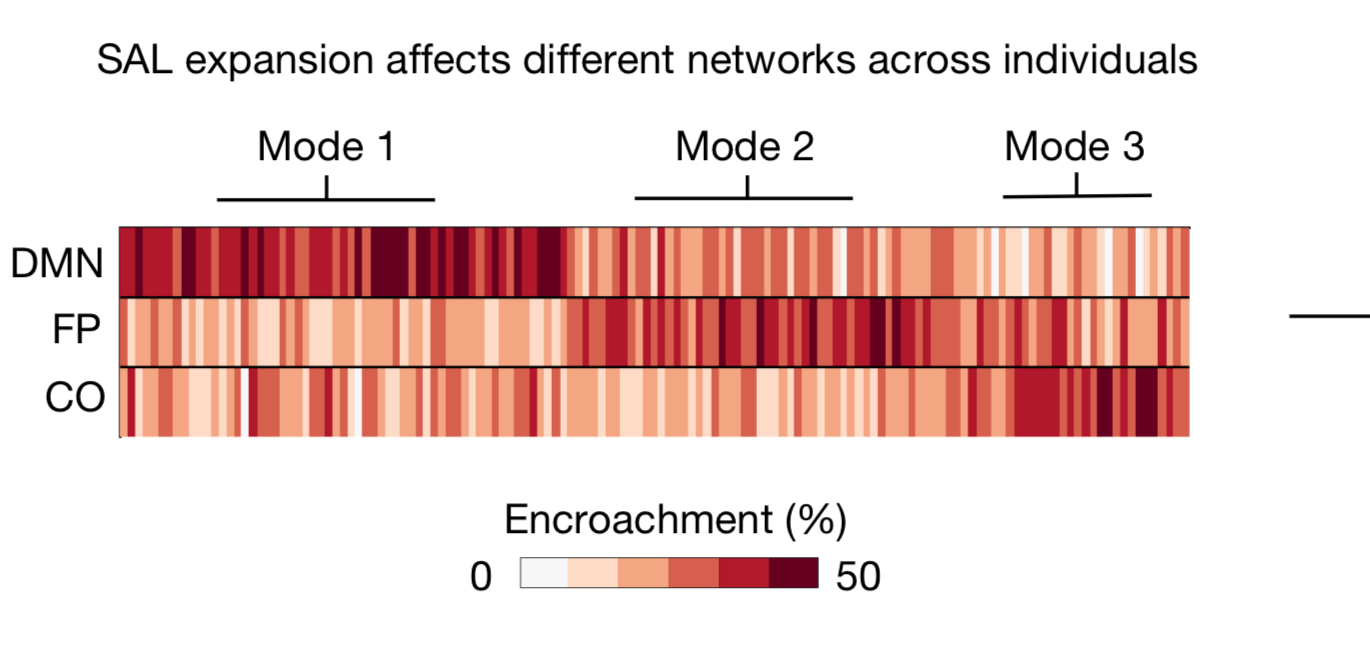
I would like to reproduce the color bar from the attached image taken from Lynch et al., 2024. In particular, I would like to exclusively include labels for the max and min. I know how to do this with a continuous color bar, but I am interested in doing it for a stepwise gradient. Is this possible?
Welcome to the forum.
You have not given us much to go on. Lynch et al., 2024. is a bit cryptic. What journal?
It would help to see what you have already done and to see some sample data.
Copy the code and paste it here between
```
```
This gives us formatted code that we can copy, paste and run .
A handy way to supply data is to use the dput() function. Do dput(mydata) where "mydata" is the name of your dataset. For really large datasets probably dput(head(mydata, 100) will do.
You may also find this helpful.
https://forum.posit.co/t/faq-how-to-do-a-minimal-reproducible-example-reprex-for-beginner00)) will do. Paste the output between
```
```