Good afternoon,
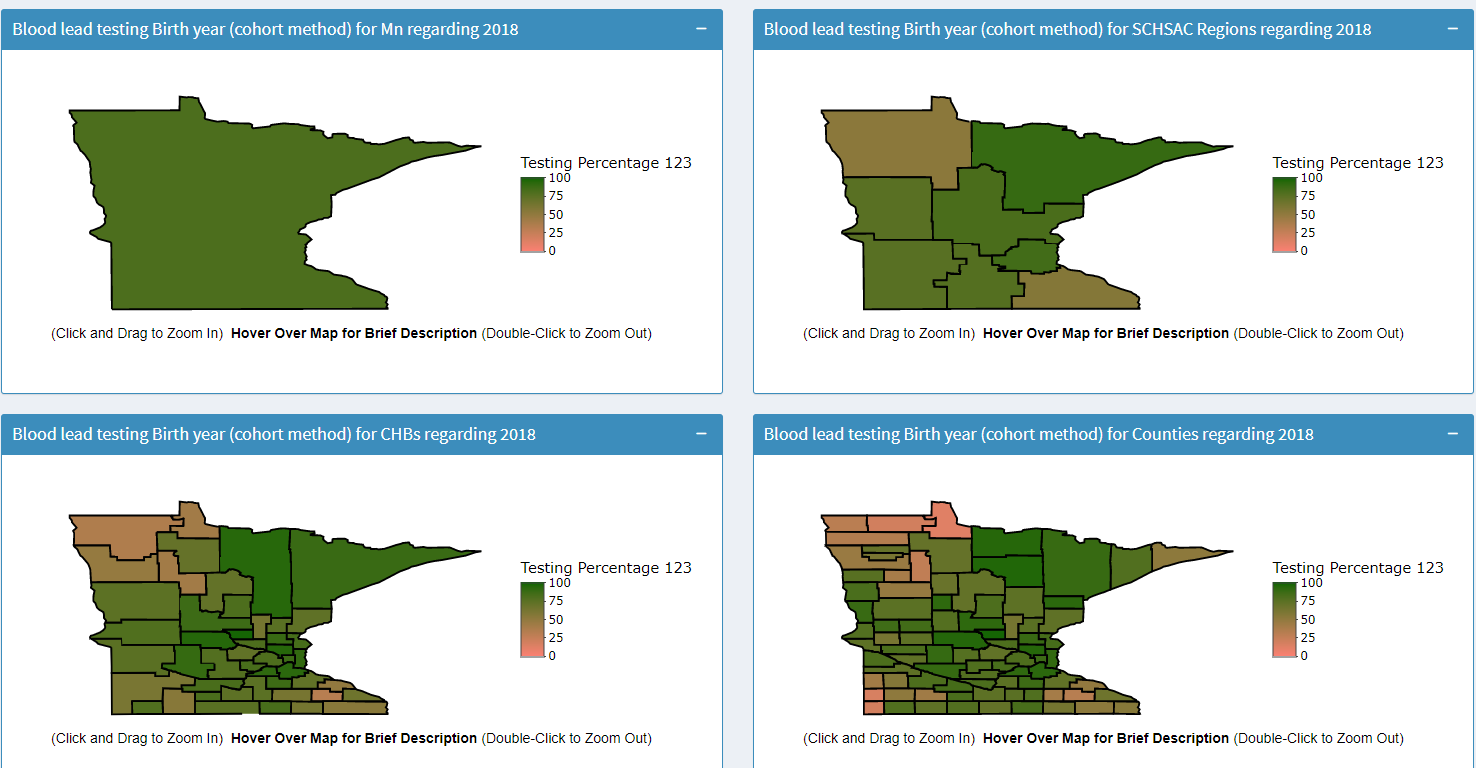
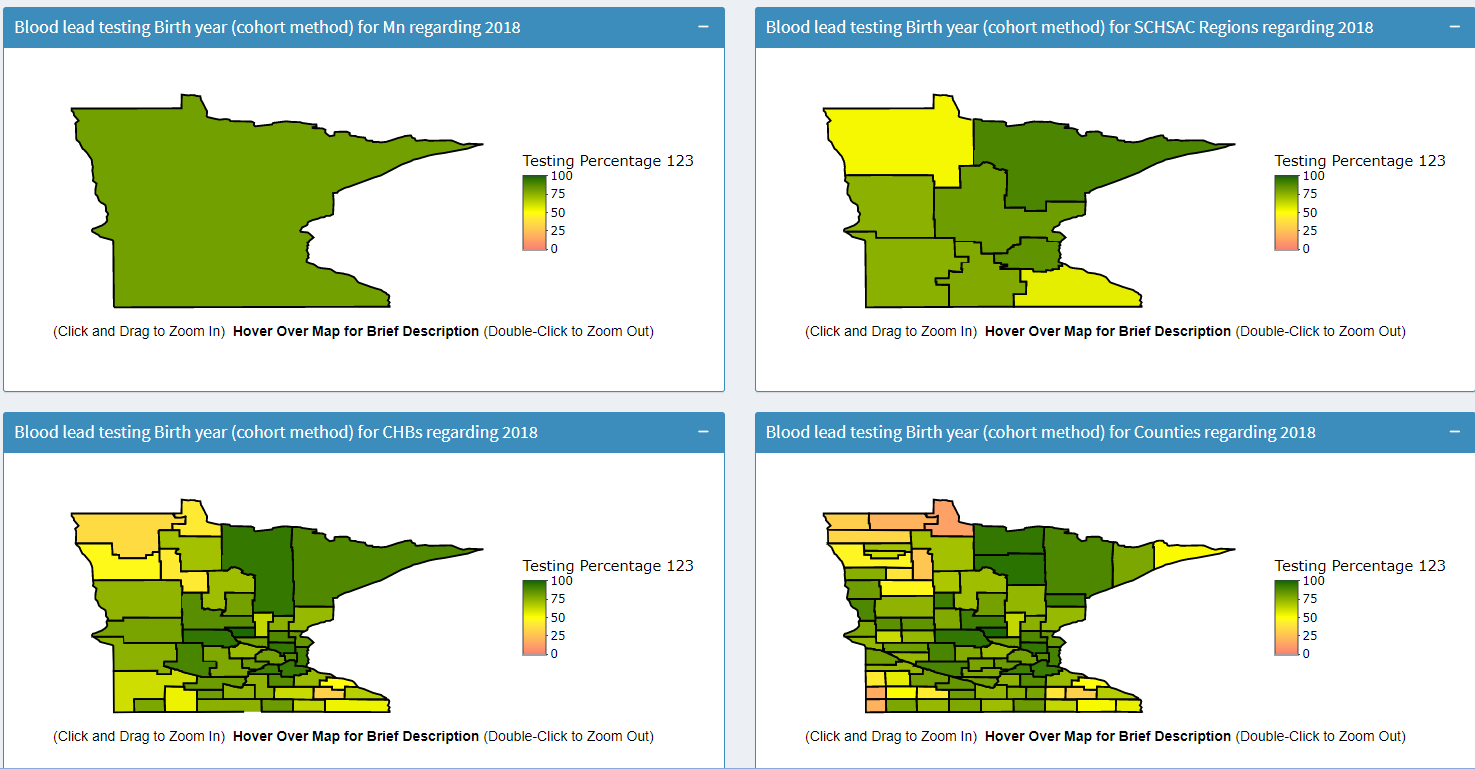
Thank you ggplot2 developers for the map_data function. I was able to utilize the map_date function which allowed me to create two different region groups for Minnesota. I have two issues but will only address one in this post. As shown in the the image below for Minnesota the gradient scale does not reflect the map. I believe it has to do with the Minnesota map only has one value for the group and when it maps it, the scale can't determine the low and high ranged values because there is only one value. Below is my code for my ggplot. The if/else logic is required so my MN map doesn't appear as brown.
spacialLead <-
ggplot2::ggplot(leadReactive(),
ggplot2::aes(x = spacialLong, y = spacialLat,
group = spacialGroup, fill = spacialFill,
text = paste(
spacialLocation,
"\nTesting Percentage:", spacialFill,
"\n", test)
)) +
ggplot2::geom_polygon(color = "black") +
ggplot2::labs(fill = "Testing Percentage")
  spacialLead <-
    if(geographyTrigger == "mn")
    {spacialLead + ggplot2::scale_fill_gradient(high = "darkgreen" )}
  else
    {spacialLead + ggplot2::scale_fill_gradient(low = "salmon", high = "darkgreen")}
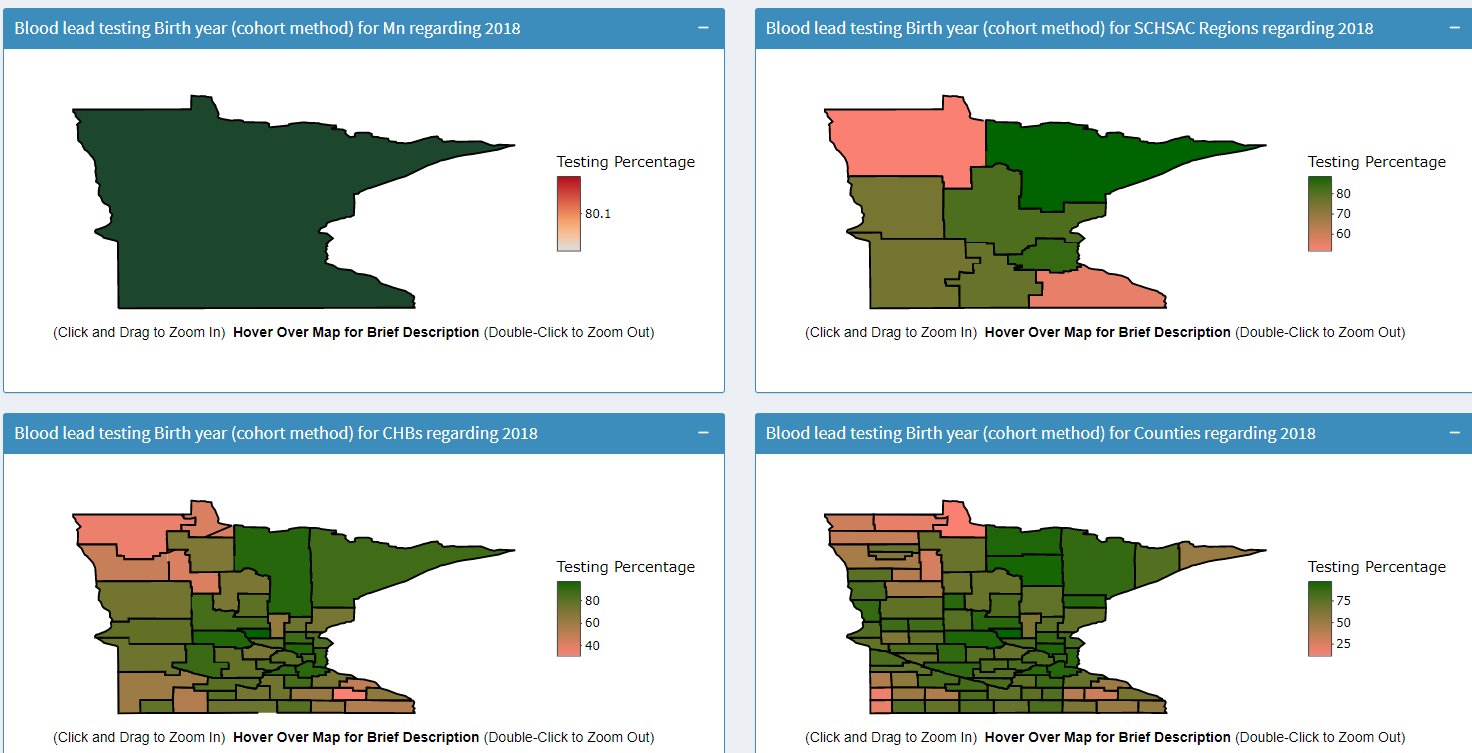
My question is, is there a way to make the scale_fill_gradient show green instead of red for the MN map when the MN map does not have a low and high value? There is only one value for the MN map.
Edit** I just learned that it has to do with when I convert my ggplot to a plotly object. Below is my plotly code.
spacialLeadPlotly <- plotly::ggplotly(spacialLead, tooltip = "text") |>
plotly::config(displayModeBar = FALSE, doubleClickDelay = 1000) |> # Helps improve functionality when zooming in and out and removes top mod bar
plotly::layout(
annotations = list(
list(
x = 0,
y = -0.1, #The annotation is put at the bottom so when someone zooms in the words don't appear over the map
text = '(Click and Drag to Zoom In) Hover Over Map for Brief Description (Double-Click to Zoom Out)',
font = list(
family = "sans-serif",
size = 14,
color = "black"
),
xref='paper',
yref='paper',
showarrow = F
)
),
#I have no idea why this doesn't work correctly but for some reason I have to define in the ggplot object
# legend = list(
# title=list(text='Test'),
# y = 0.5 # Put legend in the center of the y-axis
# )
#,
xaxis = list(visible = FALSE), # Hide x-axis
yaxis = list(visible = FALSE), # Hide y-axis
plot_bgcolor = "white", # Set background to white
paper_bgcolor = "white" # Set background to white
)
Thank you