Hello, I just came across a weird problem using Rstudio on Windows (tried on both 2024.04.2-764 and 2023.12.1-402 builds). The issue is when I try to make a plot using ggtree's aligning-tiplab-vertically (as_ylab) function, the plot in the Rstudio plot panel would have extra tiny labels next to the tips (which should not be there). See below plot:
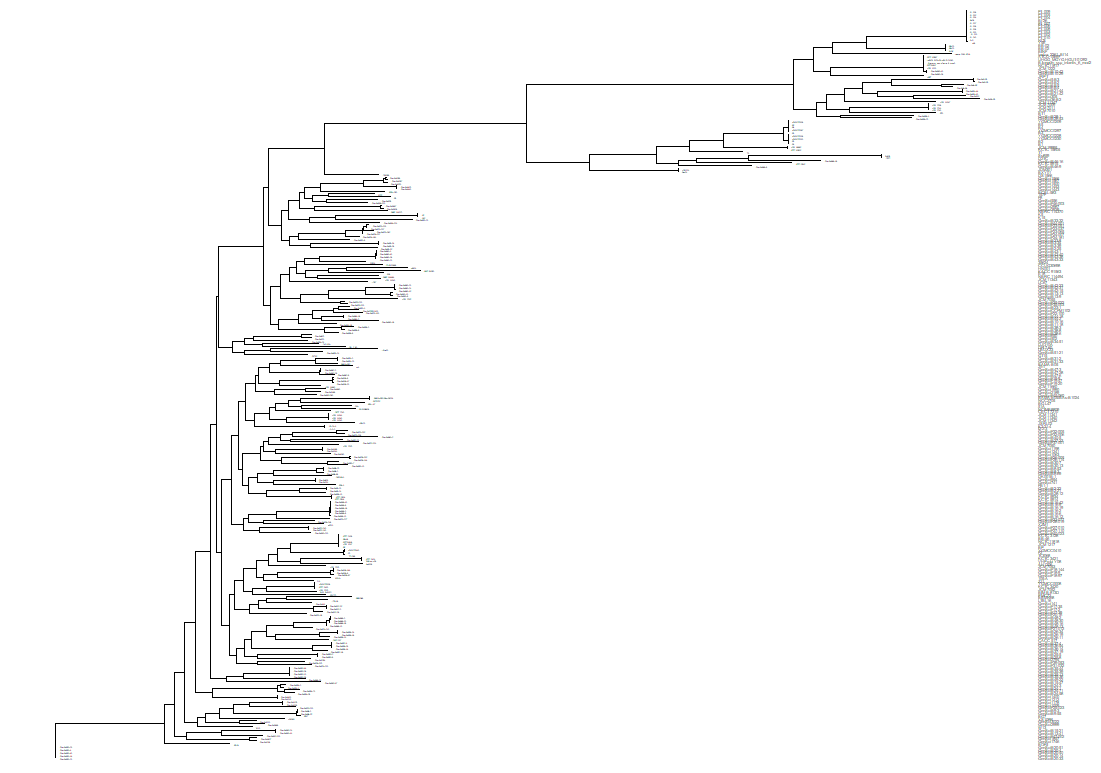
A reproducible minimum code is as follow (although it is harder to notice but the extra labels are still there):
library(ggtree)

nwk <- system.file("extdata", "sample.nwk", package="treeio")
tre <- read.tree(nwk)

ggtree(tre) + geom_tiplab(as_ylab = T)
I was able to identify the problem seems due to R/Rstudio's default graphic device (but I don't recall this happens on when I use MacOS or linux before), given (1) using ggsave would produce correct output graph no matter if it is pdf or png file; (2) export the plot directly from the Rstudio plot panel would produce incorrect png graph. (3) finally, manually changing the Rstudio's graphic device from default to either cairo or AGG would produce correct plot.
My question is should I just switching the graphic device in Rstudio to AGG or cairo.
sessionInfo output:
R version 4.4.1 (2024-06-14 ucrt)
Platform: x86_64-w64-mingw32/x64
Running under: Windows 10 x64 (build 19045)

Matrix products: default


locale:
[1] LC_COLLATE=English_United States.utf8  LC_CTYPE=English_United States.utf8
[3] LC_MONETARY=English_United States.utf8 LC_NUMERIC=C
[5] LC_TIME=English_United States.utf8

time zone: Asia/Shanghai
tzcode source: internal

attached base packages:
[1] stats     graphics  grDevices utils     datasets  methods   base

other attached packages:
 [1] treeio_1.28.0   ggtree_3.12.0   here_1.0.1      lubridate_1.9.3 forcats_1.0.0   stringr_1.5.1
 [7] dplyr_1.1.4     purrr_1.0.2     readr_2.1.5     tidyr_1.3.1     tibble_3.2.1    ggplot2_3.5.1
[13] tidyverse_2.0.0

loaded via a namespace (and not attached):
 [1] yulab.utils_0.1.5  utf8_1.2.4         generics_0.1.3     ggplotify_0.1.2    stringi_1.8.4
 [6] lattice_0.22-6     hms_1.1.3          digest_0.6.36      magrittr_2.0.3     grid_4.4.1
[11] timechange_0.3.0   fastmap_1.2.0      jsonlite_1.8.8     rprojroot_2.0.4    ape_5.8
[16] fansi_1.0.6        aplot_0.2.3        scales_1.3.0       textshaping_0.4.0  lazyeval_0.2.2
[21] cli_3.6.3          rlang_1.1.4        munsell_0.5.1      tidytree_0.4.6     withr_3.0.1
[26] cachem_1.1.0       tools_4.4.1        parallel_4.4.1     tzdb_0.4.0         memoise_2.0.1
[31] colorspace_2.1-0   gridGraphics_0.5-1 vctrs_0.6.5        R6_2.5.1           lifecycle_1.0.4
[36] fs_1.6.4           ggfun_0.1.5        ragg_1.3.2         pkgconfig_2.0.3    pillar_1.9.0
[41] gtable_0.3.5       glue_1.7.0         Rcpp_1.0.13        systemfonts_1.1.0  tidyselect_1.2.1
[46] rstudioapi_0.16.0  farver_2.1.2       patchwork_1.2.0    nlme_3.1-164       labeling_0.4.3
[51] compiler_4.4.1