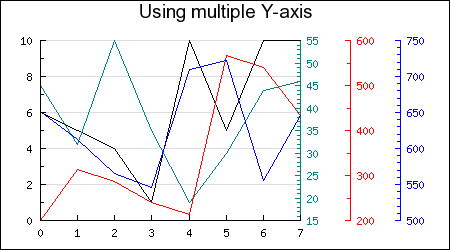
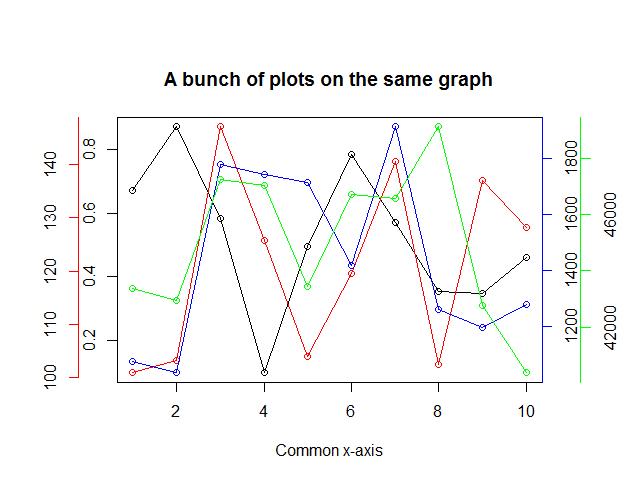
Each column indicates the movement of the price per date for a product. It is therefore necessary to have the date on the X axis. I want to superimpose the graphs to analyze the evolution of the total price of different products all together.
The result must be similar to the captures in the links Below :