I'm new to R Studio and have built some scatterplots using the Lattice and Latticeextra packages. I'm struggling to find code that allows me to change the Facet Heading titles to Italics. Any advice is appreciated. My current code and plots are below. Thank you for any help and advice.
library(ggplot2)
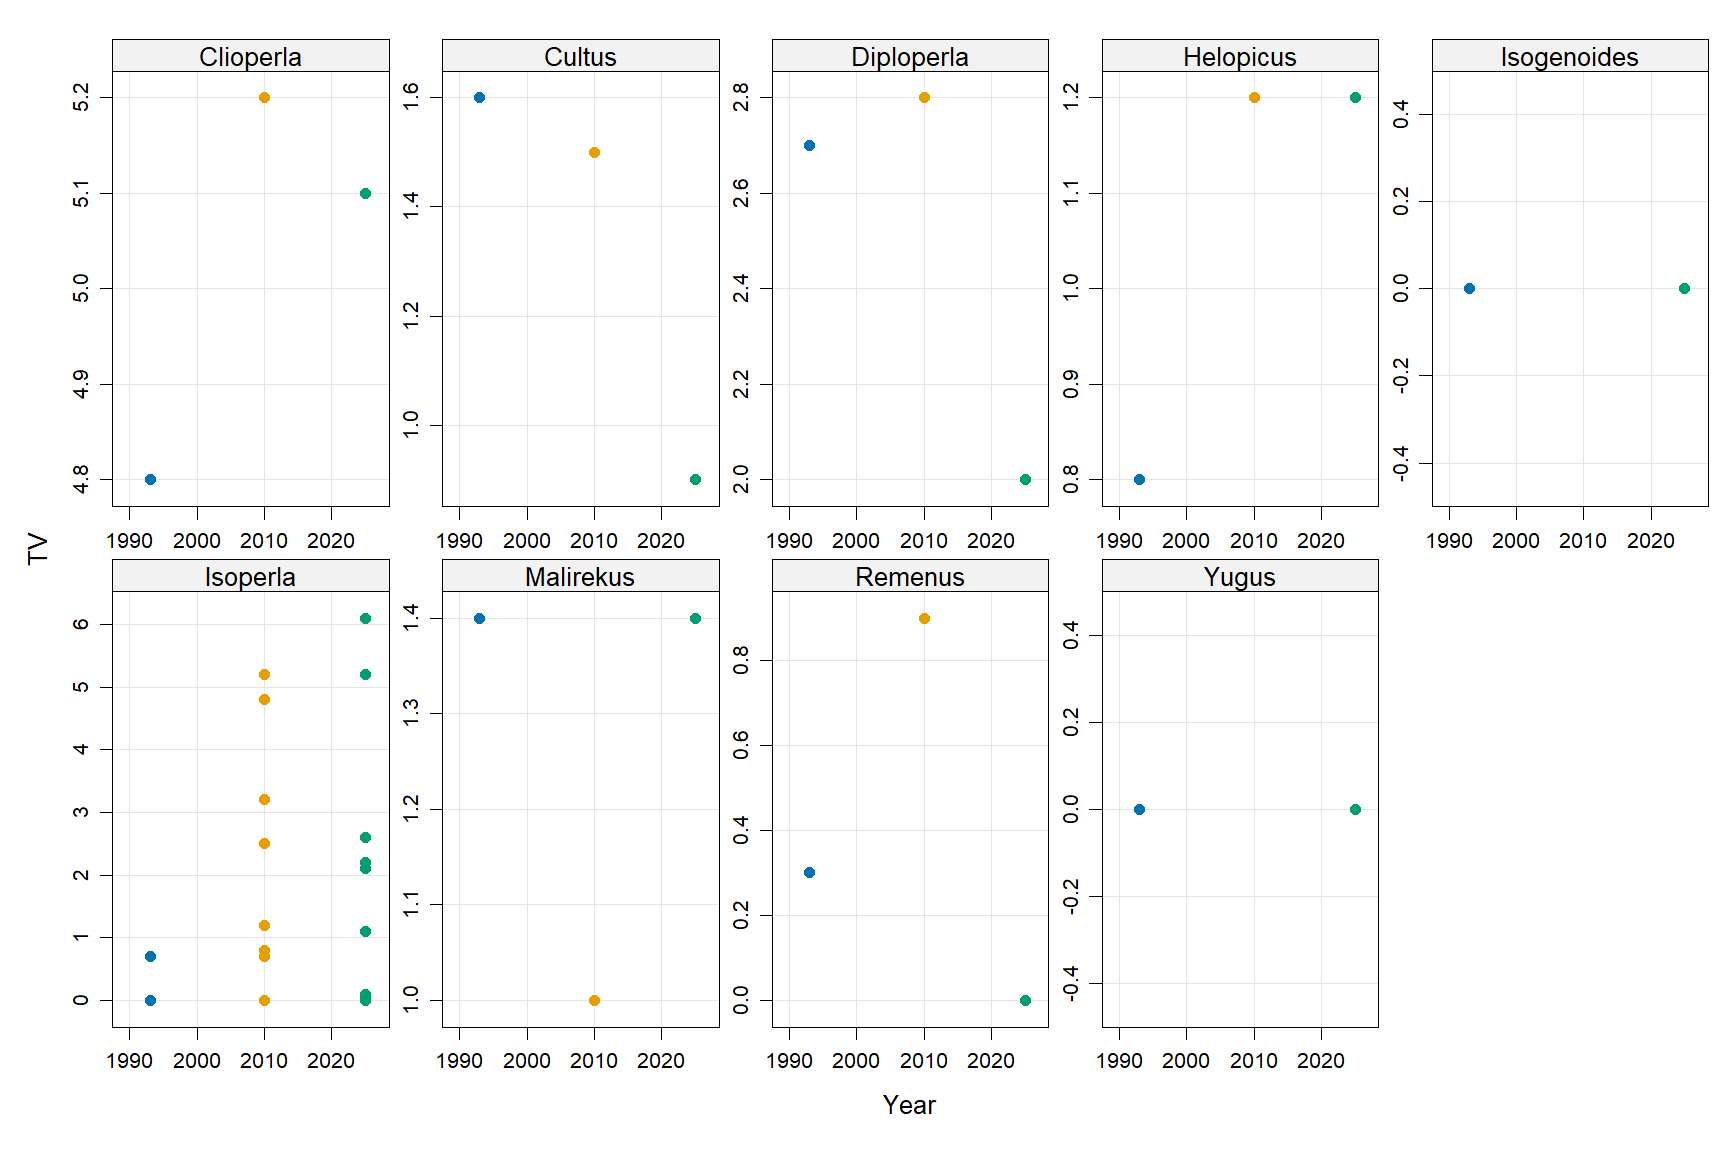
This resulting plot is below but I struggle to figure out how to change each facet heading (i.e. "Isoperla....") to italics. Thank you again for any help.
vedoa
June 15, 2025, 6:28pm
2
Hi @Bughead1977 .
hope it helps:
library(ggplot2)
library(ggtext)
library(lattice)
library(latticeExtra)
library(grid)

# Since no MyData was provided
set.seed(1)
MyData <- data.frame(
  Year = rep(1990:2025, times = 3),
  TV = c(
    rnorm(36, mean = 50, sd = 10),
    rnorm(36, mean = 60, sd = 12),
    rnorm(36, mean = 70, sd = 15)
  ),
  Genera = rep(c("Isoperla", "Baetis", "Hydropsyche"), each = 36)
)


# Levels to italicize
italicize_levels <- c("Isoperla")

# Custom strip function
custom_strip <- function(which.given,
                         which.panel,
                         var.name,
                         factor.levels,
                         ...) {
  label <- factor.levels[which.panel[which.given]]
  if (label %in% italicize_levels) {
    grid::grid.text(expression(italic(Isoperla)), 0.5, 0.5)
  } else {
    grid::grid.text(label, 0.5, 0.5)
  }
}

# Custom strip function with background and border
custom_strip <- function(which.given,
                         which.panel,
                         var.name,
                         factor.levels,
                         ...) {
  label <- factor.levels[which.panel[which.given]]

  # Draw the strip background and border
  grid.rect(gp = gpar(
    fill = trellis.par.get("strip.background")$col[1],
    col = "black"
  ))

  # Draw the label
  if (label %in% italicize_levels) {
    grid.text(bquote(italic(.(label))), 0.5, 0.5)
  } else {
    grid.text(label, 0.5, 0.5)
  }
}

# Plot
xyplot(
  TV ~ Year | Genera,
  data = MyData,
  pch = 16,
  lwd = 1.5,
  xlim = c(1990, 2026),
  as.table = TRUE,
  group = Year,
  grid = TRUE,
  scales = list(relation = "free"),
  strip = custom_strip
)
xyplot(
  TV ~ Year | Genera,
  pch = 16,
  lwd = 1.5,
  xlim = c(1990, 2026),
  as.table = TRUE,
  group = Year,
  grid = TRUE,
  data = MyData,
  scales = "free",
  strip = function(which.given, which.panel, var.name, ...) {
    strip.default(
      which.given,
      which.panel,
      var.name,
      strip.names = TRUE,
      factor.levels = do.call(
        "expression",
        lapply(
          levels(factor(MyData$Genera)),
          function(x) substitute(italic(x), list(x = x))
        )
      )
    )
  }
)
Wonderful! Thanks so much for the help!
Thank you!
Thank you so much. These replies are exactly what I was trying to do but not experienced enough on my end. Thank you.
system
September 13, 2025, 6:56pm
7
This topic was automatically closed 90 days after the last reply. New replies are no longer allowed.