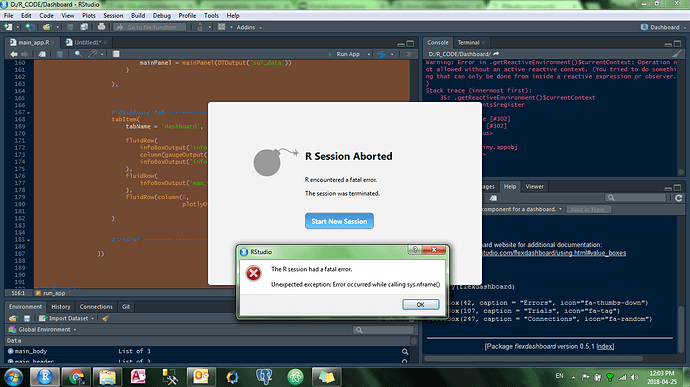
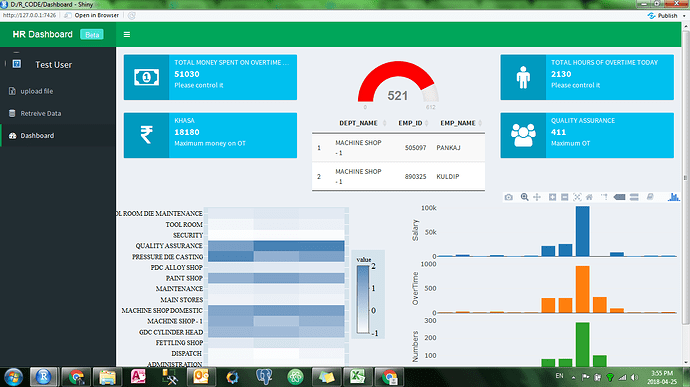
I have a shiny app. This is the code. It runs fine but when I close it. entire Rstudio crashes and then I have to restart it again. I have no idea what am I doing wrong. It's portable so if you copy and paste the code it should run on your machine too..
# Load_Libraries ----------------------------------------------------------
library(RPostgres)
library(readxl)
library(ggthemes)
library(plotly)
library(lubridate)
library(DBI)
library(pool)
library(data.table)
library(shiny)
library(shinyBS)
library(flexdashboard)
library(shinydashboard)
library(dashboardthemes)
library(tidyverse)
library(shinyjs)
library(DT)
library(RSQLite)
library(DBI)
options(shiny.maxRequestSize = 200 * 1024 ^ 2)
dir.create("www", showWarnings = FALSE)
# Header ------------------------------------------------------------------
main_header <- dashboardHeader(
title = shinyDashboardLogoDIY(
boldText = "HR",
mainText = "Dashboard",
badgeText = "Beta",
textSize = 18,
badgeTextColor = "white",
badgeTextSize = 2,
badgeBackColor = "#40E0D0",
badgeBorderRadius = 3
)
)
# Sidebar -----------------------------------------------------------------
main_siderbar <- dashboardSidebar(
sidebarUserPanel(name = h4('Test User'),
image = 'www/logo.png'),
sidebarMenu(
# upload_file_menu --------------------------------------------------------
menuItem(
text = 'upload file',
icon = icon('file-excel-o', lib = 'font-awesome'),
tabName = 'file_tab'
),
# see_file_menu -----------------------------------------------------------
menuItem(
text = 'Retreive Data',
tabName = 'sql_tab',
icon = icon('database', lib = 'font-awesome')
),
# Dashboard_menu ----------------------------------------------------------
menuItem(
text = 'Dashboard',
tabName = 'dashboard',
icon = icon('dashboard', lib = 'font-awesome')
)
)
)
# Body --------------------------------------------------------------------
main_body <-
dashboardBody(# themes ------------------------------------------------------------------
# shinyDashboardThemes(
# theme = "grey_light"
# ),
# file_tab -----------------------------------------------------------------
tabItems(
tabItem(
tabName = "file_tab",
sidebarLayout(
sidebarPanel = sidebarPanel(
radioButtons(
"file_type",
label = ("Please Select the Type of File uploaded"),
choices = list("XLSX" = 'XLSX', "CSV" = 'CSV'),
selected = "XLSX"
),
fileInput(
"file_upload",
"Choose a File",
accept = c(
"text/csv",
"xlsx",
"xls",
"text/comma-separated-values,text/plain",
".csv"
)
),
uiOutput('select_sheet'),
selectInput(
'table_sql',
label = 'Please select the Table',
choices = c('casual', 'attendence', 'permanent', 'costing'),
multiple = FALSE
),
radioButtons(
inputId = 'checkaction',
label = 'Please select an action',
choices = list("Append" = 'append', "overwrite" = 'overwrite'),
selected = "append"
),
actionButton(
'file_upload_sql',
' upload in database',
icon = icon('database', lib = 'font-awesome'),
width = '90%'
)
),
mainPanel = mainPanel(DTOutput('file_data'))
)
),
# sql_tab -----------------------------------------------------------------
tabItem(
tabName = "sql_tab",
sidebarLayout(
sidebarPanel = sidebarPanel(uiOutput('select_input_table1')),
mainPanel = mainPanel(DTOutput('sql_data'))
)
),
# Dashboard tab -----------------------------------------------------------
tabItem(
tabName = 'dashboard',
fluidRow(
infoBoxOutput('info_salary_ot'),
column(gaugeOutput('guage_chart', height = "auto"), width = 4),
infoBoxOutput('info_ot_hours')
),
fluidRow(
infoBoxOutput('max_OT_Dept')
),
fluidRow(column(6,
plotlyOutput('heatmap')))
)
# endTab ------------------------------------------------------------------
))
# Ui_function -------------------------------------------------------------
main_ui <- dashboardPage(skin = 'green',
main_header,
main_siderbar,
main_body)
# Server_Function ---------------------------------------------------------
main_server <- function(input, output, session) {
# connect_database --------------------------------------------------------
sql <- reactive({
dbPool(SQLite(),
dbname = 'www/maindata.sqlite')
})
# Check number of Sheets --------------------------------------------------
output$select_sheet <- renderUI({
req(input$file_upload)
if (input$file_type == 'XLSX') {
if (input$file_upload$name %>% str_detect('.xlsx')) {
selectInput(
'i_select_sheet',
'Select Sheet',
choices = excel_sheets(input$file_upload$datapath),
multiple = FALSE,
selected = 1
)
} else{
return(NULL)
}
} else{
return(NULL)
}
})
# create_data -------------------------------------------------------------
file_table <- reactive({
req(input$file_upload)
if (input$file_type == 'XLSX') {
if (input$file_upload$name %>% str_detect('.xlsx')) {
req(input$i_select_sheet)
setDT(
read_excel(
input$file_upload$datapath,
sheet = input$i_select_sheet
)
)
} else{
return(NULL)
}
} else{
if (input$file_upload$name %>% str_detect('.csv')) {
fread(input$file_upload$datapath)
} else{
return(NULL)
}
}
})
# Render_Table ------------------------------------------------------------
output$file_data <- renderDT(
# put CSV, XLS, and PDF in a collection
file_table(),
extensions = 'Buttons',
filter = 'top',
options = list(
dom = 'TlBfrtip',
scrollX = TRUE,
scrollY = 400,
scrollCollapse = TRUE,
lengthMenu = c(5, 10, 50, 100, 200),
pageLength = 5,
buttons =
list(
'colvis',
'copy',
'print',
list(
extend = 'collection',
buttons = c('csv', 'excel', 'pdf'),
text = 'Download'
)
)
)
)
# number of tables --------------------------------------------------------
sql_list_table <- reactive({
dbListTables(sql())
})
# Create Select input widget 2 --------------------------------------------
output$select_input_table1 <- renderUI({
selectInput(
'sql_table',
label = 'Please select the Table',
choices = sql_list_table(),
multiple = FALSE
)
})
# Upload_in_SQL -------------------------------------------------------------
observeEvent(input$file_upload_sql,
{
if (input$checkaction == 'append') {
dbWriteTable(sql(),
input$table_sql,
value = file_table(),
append = TRUE)
} else{
dbWriteTable(sql(),
input$table_sql,
value = file_table(),
overwrite = TRUE)
}
})
# reset_fileinput ---------------------------------------------------------------
observeEvent(input$file_upload_sql, {
reset('file_upload')
})
# get data SQL----------------------------------------------------------------
sql_table_data <- reactive({
dbGetQuery(sql(),
paste('select * from ',
input$sql_table))
})
# render_data -------------------------------------------------------------
output$sql_data <- renderDT(
# put CSV, XLS, and PDF in a collection
sql_table_data(),
extensions = 'Buttons',
filter = 'top',
options = list(
dom = 'TlBfrtip',
scrollX = TRUE,
scrollY = 400,
scrollCollapse = TRUE,
lengthMenu = c(5, 10, 50, 100, 200),
pageLength = 5,
buttons =
list(
'colvis',
'copy',
'print',
list(
extend = 'collection',
buttons = c('csv', 'excel', 'pdf'),
text = 'Download'
)
)
)
)
# show_message ------------------------------------------------------------
observeEvent(input$file_upload_sql, {
showModal(
modalDialog(
title = "data uploaded",
"Please Don't click upload again untill you change the file!",
easyClose = FALSE
)
)
})
# Get_Full_Data from SQL --------------------------------------------------
attendence <- reactive({
attendence <- dbGetQuery(
sql(),
'select * from attendence left join casual on attendence.EMP_ID= casual.EMP_ID'
)
setDT(attendence)
setkey(attendence, EMP_ID)
attendence[, ':='(OT_DATE = as.POSIXct.numeric(OT_DATE, origin = '1970-01-01'))]
attendence[, ':='(SALARY_today = SALARY / days_in_month(OT_DATE))]
})
# Create HeatMap ----------------------------------------------------------
output$heatmap <- renderPlotly({
(
(
attendence()[, .(
Salary = round(sum(SALARY_today, na.rm = TRUE))
,
OverTime = sum(MAN_OT),
Numbers = .N
), DEPT_NAME][, .(
DEPT_NAME,
Salary = scale(Salary),
OverTime = scale(OverTime),
Numbers = scale(Numbers)
)] %>%
melt.data.table(id.vars = 'DEPT_NAME')
) %>%
ggplot(aes(variable, DEPT_NAME)) +
geom_tile(aes(fill = value), colour = "white") +
scale_fill_gradient(low = "white", high = "steelblue") +
theme_economist() +
theme(
axis.title.y = element_blank(),
axis.title.x = element_blank()
)
) %>%
ggplotly()
})
# render Guage Chart ------------------------------------------------------
output$guage_chart = renderGauge({
gauge(
attendence()[MAN_OT > 0 & (!is.na(MAN_OT)) , .N],
min = 0,
max = attendence()[, .N],
gaugeSectors(
success = c(0, (attendence()[, .N]) * 30 / 100),
warning = c(((
attendence()[, .N]
) * 30 / 100) + 1, (attendence()[, .N]) * 65 / 100),
danger = c(((
attendence()[, .N]
) * 65 / 100) + 1, (attendence()[, .N]))
)
)
})
# Info_Box_salary ---------------------------------------------------------
output$info_salary_ot <- renderInfoBox({
infoBox(
'Total Money Spent on OverTime Today',
subtitle = 'Please control it',
fill = TRUE,
value = attendence()[, (Total_OT = round(sum(
2 * SALARY_today * MAN_OT / 24, na.rm = TRUE
)))]
,
icon = icon('money')
)
})
# info_Box_OverTime -------------------------------------------------------
output$info_ot_hours <- renderInfoBox({
infoBox(
'Total Hours of OverTime Today',
subtitle = 'Please control it',
fill = TRUE,
value = attendence()[, (sum(MAN_OT))],
icon = icon('male')
)
})
# Value_Box_Top_ OverTime -------------------------------------------------
output$max_OT_Dept <- renderInfoBox({
infoBox(
attendence()[,.(OverTime=sum(MAN_OT,na.rm = TRUE)),DEPT_NAME][
which.max(OverTime),][,DEPT_NAME],
subtitle = "Maximum OT",
fill = TRUE,
value = attendence()[,.(OverTime=sum(MAN_OT,na.rm = TRUE)),DEPT_NAME][
which.max(OverTime),][,OverTime],
icon = icon('users')
)
})
# Session_close -----------------------------------------------------------
session$onSessionEnded(function() {
poolClose(sql())
})
# endServer ---------------------------------------------------------------
}
# run_app -----------------------------------------------------------------
shinyApp(main_ui, main_server)


