The where component of the rpart() output tells you in which leaf of the tree each observation ended. Leaves are identified by the row number of the rpart$frame data frame. Below is a simple example. Each observation is in category A or B. The two predictive variables are X1 and X2. If both of them have high values or both have low values, the observation has an Outcome of A. If one is high and the other is low, the Outcome is B.
library(rpart)
#> Warning: package 'rpart' was built under R version 3.5.3
library(rpart.plot)
#> Warning: package 'rpart.plot' was built under R version 3.5.3
suppressPackageStartupMessages(library(dplyr))
set.seed(34562)
df <- data.frame(Outcome = rep(c("A", "B"), each = 10),
                 X1 = c(rnorm(8, 1, 1), rnorm(2, 6, 1),
                        rnorm(8, 6, 1), rnorm(2, 1, 1)),
                 X2 = c(10,10,10,10, 10,10,10,10,20, 20, 10,10,10,10, 10,10,10,10,20,20))
tree <- rpart(formula = Outcome ~ X1 + X2, data = df, method = "class",
              control = rpart.control(minsplit = 5))
rpart.plot(tree, extra = 1)
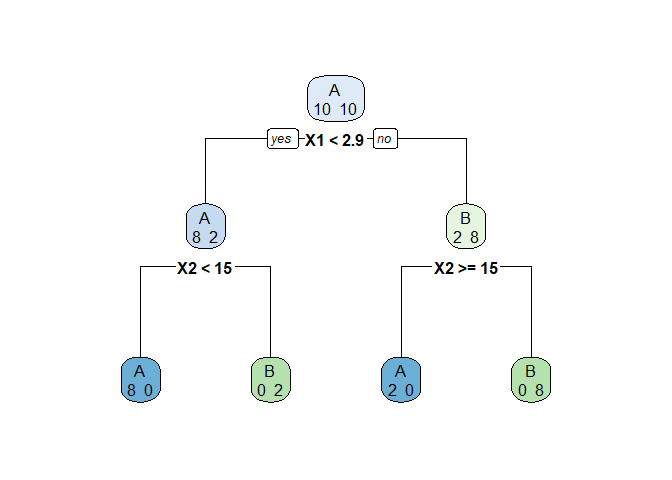
tree$frame %>% select(var, n, dev)
#>      var  n dev
#> 1     X1 20  10
#> 2     X2 10   2
#> 4 <leaf>  8   0
#> 5 <leaf>  2   0
#> 3     X2 10   2
#> 6 <leaf>  2   0
#> 7 <leaf>  8   0
tree$where
#>  1  2  3  4  5  6  7  8  9 10 11 12 13 14 15 16 17 18 19 20
#>  3  3  3  3  3  3  3  3  6  6  7  7  7  7  7  7  7  7  4  4
Created on 2019-05-31 by the reprex package (v0.2.1)
Looking at the selected columns of tree$frame, there are four leaves in rows 3, 4, 6 and 7. n is the number of observations in the leaf and dev is the number of incorrectly assigned observations Don't be confused by the leaf id numbers in the order 1,2,4,5,3,6,7. Those are not row numbers! Looking at the output of tree$where, you can see that the first 8 observations ended up in row 3. That is the leaf with low X1 and low X2 at the far left of the plot. You can tell that by looking at the values in df. The next two observations end up in row 6 of tree$frame; high X1 and high X2 with 2 observations.