Rmarkdown won't compile PDF with tables

When trying to compile this script as a PDF using Rstudio, I get the following error message:
Error in paste():
! invalid 'collapse' argument
Backtrace:

  1. kableExtra::kbl(...)
  2. knitr::kable(...)
  3. knitr:::kable_latex(...)
  4. base::paste(align, collapse = vline)

Running the script line by line works perfectly. Compiling to HTML as well. I Use the File->Compile Report command in Rstudio to do this. So, it seems to be the case that Latex does not like the tables included.

It should be noted that I have MikTex as well as TinyTex installed on a Windows 10 computer. As tinytex::is_tinytex() returns TRUE, I assume that TinyTex is indeed used (not MikTex). Rstudio as well as the packages KableExtra, knitr, rmarkown and tinytex haven been updated to the latest versions. As uploading R-files and data is not allowed here, I provide a screenshot of my script.

To supply code simpley copy it and and paste it here between
```

```

A handy way to supply some sample data is the dput() function. In the case of a large dataset something like dput(head(mydata, 100)) should supply the data we need. Just do dput(mydata) where mydata is your data. Copy the output and paste it here between
```

```

Have you tried using LaTeX in a .rmd or .qmd document?

Try something like

$\sigma^2 = \frac{1}{3}\sqrt{\alpha}$

Does it run?

I tried installing tinytex alongside TexLive and ran into serious problems about a year ago. As I have a full TexLive installation I junked tinytex.

1 Like

Thank you for the advice. I wasn't aware of the dput-function until now. This is my code:


#creates data frames
Datum<-as.data.frame(c(1706630620, 1706630638, 1706630657,
1706634604, 1706634668, 1706713347, 1706713462, 1706713517, 1706800923,
1706801182, 1706801418, 1707312101, 1707312342, 1707312639, 1707314100,
1707314172, 1707389396, 1707389732, 1707389801, 1707391257, 1707391620,
1707391988, 1708697243))
Alter<-as.data.frame(c(2, 4, 4, 1, 4, 1, 2, 4, 2, 3, 4, 1, 3, 4, 1, 3,
1, 3, 4, 4, 3, 1, 2))
Sprachversion<-as.data.frame(c(3, 1, 1, 3, 1, 3,
3, 1, 3, 2, 1, 3, 2, 1, 3, 2, 3, 2, 1, 1, 2, 3, 3))
d<-cbind(Datum, Alter, Sprachversion)
names(d)<-c("Datum", "Alter", "Sprachversion")
rm(Alter, Datum, Sprachversion)

#table Alter
t<-as.data.frame(descr::freq(d$Alter, plot = F))
if(ncol(t) == 2) {names(t)<-c("Häufigkeit", "Prozentsatz")}
k1<-kableExtra::kbl(t, vline = TRUE, booktabs = T, align = c("c", "c"), digits = 0)
k2<-kableExtra::row_spec(k1, 0, bold = T)
kableExtra::kable_classic(k2)

#crosstable Alter x Sprachversion
dd<-descr::CrossTable(d$Sprachversion, d$Alter, prop.chisq = F)
t<-dd$tab
k1<-kableExtra::kbl(t, vline = TRUE, booktabs = T, align = c("c", "c", "c"), digits = 2, row.names = T)
k2<-kableExtra::kable_classic(k1)
kableExtra::add_header_above(k2, c("Sprachversion" = 1, "Alter" = 4), line_sep = 6, bold = T)

Actually, this is a normal R script which can be compiled using the File->Compile Report function in Rstudio. However, when using a similiar code in an Rmd-File, it produces the same error message:

Error in paste():
! invalid 'collapse' Argument
Backtrace:

  1. kableExtra::kbl(...)
  2. knitr::kable(...)
  3. knitr:::kable_latex(...)
  4. base::paste(align, collapse = vline)

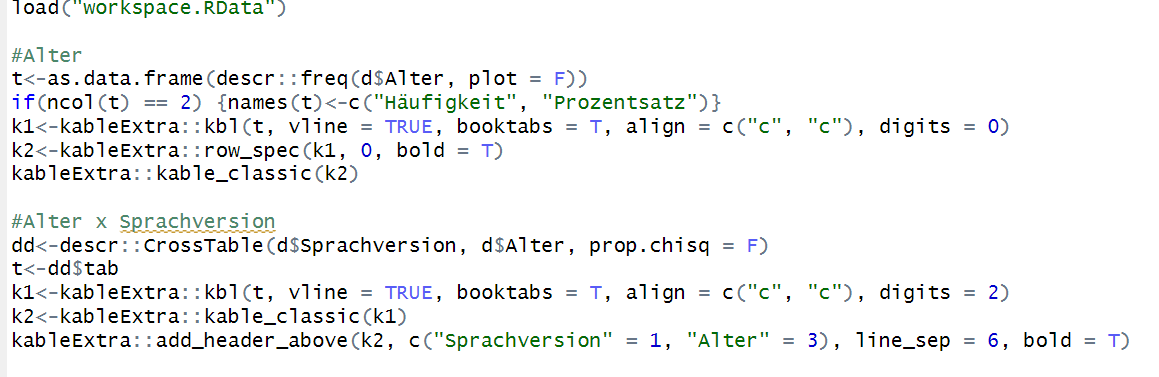
I think I have found the problem. You cannot use vline if you are using booktabs here.

k1<-kableExtra::kbl(t, vline = TRUE, booktabs = T, align = c("c", "c", "c"), digits = 2, row.names = T)

This works

k1 <-kbl(altt , booktabs = T, align = c("c", "c"), digits = 0)

I should have seen it immediately. The author of the {booktabs} package despises vertical lines in a table.

BTW you have a lot of code there that you don't really need. I chopped out some which should make it easier to read. I also renamed some things because it made it easier for me to check things as i worked through the code.

My version of your code. Also availible in Quarto format upon request; I don't remember any Rmarkdown.

library(descr)
library(kableExtra)

# Create data.frame
dat1 <- data.frame(datum = c(1706630620, 1706630638, 1706630657,
1706634604, 1706634668, 1706713347, 1706713462, 1706713517, 1706800923,
1706801182, 1706801418, 1707312101, 1707312342, 1707312639, 1707314100,
1707314172, 1707389396, 1707389732, 1707389801, 1707391257, 1707391620,
1707391988, 1708697243), alter = c(2, 4, 4, 1, 4, 1, 2, 4, 2, 3, 4, 1, 3, 4, 1, 3,
1, 3, 4, 4, 3, 1, 2), sprachversion = c(3, 1, 1, 3, 1, 3,
3, 1, 3, 2, 1, 3, 2, 1, 3, 2, 3, 2, 1, 1, 2, 3, 3) )

#table Alter
altt <- as.data.frame(freq(dat1$alter, plot = FALSE))
names(altt) <- c("Häufigkeit", "Prozentsatz")
k1 <-kbl(altt, vline = TRUE, booktabs = T, align = c("c", "c"), digits = 0)
k2 <-row_spec(k1, 0, bold = T)
kable_classic(k2)


#crosstable Alter x Sprachversion
dd <- CrossTable(dat1$sprachversion, dat1$alter, prop.chisq = F)
t <- dd$tab
k1 <- kableExtra::kbl(t, booktabs = T, align = c("c", "c", "c"), digits = 2, row.names = T)
k2 <- kableExtra::kable_classic(k1)
add_header_above(k2, c("Sprachversion" = 1, "Alter" = 4), line_sep = 6, bold = T)

Thank you very much for your help, jrkrideau/John Kane! Removing the vline-parameter made my script run perfectly. As is probably obvious, I do not have a lot of experience with KableExtra, so I really appreciate your help.

1 Like

This topic was automatically closed 7 days after the last reply. New replies are no longer allowed.

If you have a query related to it or one of the replies, start a new topic and refer back with a link.