I'm trying to create an rmarkdown document which shows a plot and summary for a bunch of different groups. I'd like the plot and summary to be side by side. And ideally I'd like to avoid page-breaks within a group. So a layout kind of like this
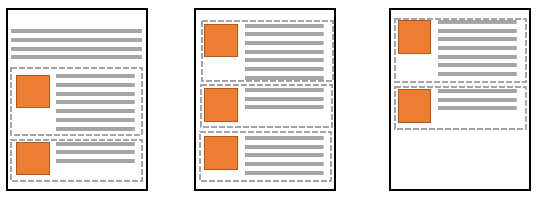
where each image (orange square) and text (grey lines) for a group (enclosed in dashed square) is contained entirely on a page.
Here's a sample HTML document which has a layout close to what I was after
---
title: "Sample Side-By-Side"
author: "Matthew "
date: "January 3, 2020"
output: html_document
---

```{r setup, include=FALSE}
knitr::opts_chunk$set(echo = TRUE)
library(ggplot2)
```

### Repeated Sections
<div style="display:grid; grid-template-columns: 25% 75%; grid-row-gap: 20px; align-self:start">
```{r,echo=FALSE, fig.width=2, fig.height=2, results='asis'}
rplot <- function() {
  # dummy function for "random" plot
  ggplot(data.frame(x=sample.int(10,1), y=sample.int(10,1))) +
    geom_point(aes(x,y)) + xlim(0,10) + ylim(0,10)
  }
set.seed(111)
for (current_id in 1:10) {
  cat('<div class="column-left">')
  print(rplot())
  cat('</div>')
  cat('<div class="column-right">')
  cat(rep("text line", sample.int(11, 1)), sep="  \n")
  cat('</div>')
}
```
</div>
Note that because this uses the CSS grid layout it doesn't seem to preview in the RStudio viewer but if you open in browser, it should put the content side by side (at least when tested with Chrome 79.0.3945.88)
But the problem with this CSS method seems to be you can't control where page breaks occur, so if you print it you get page breaks in weird spots (splitting up text or images). (Actually, I'm using the browser to "print" to PDF -- which is how I would like to send the document to others.)
I'd be happy to switch to a PDF output but I'm not sure how to get a similar layout with that output type. Is it possible to get a document that will look good when printed?