Hi,
I am new to R and I have problem with my script. I want to create plot with points and line but I cannot get geom_line to work.
The code is quite messy but I cannot modify to much of it.
data_vector <- list(c('10-10-2018', '25-10-2018', '9-11-2018', '10-10-2019', '25-10-2019', '9-11-2019'))
df1 <- data.frame(dates = as.Date(unlist(data_vector[1]), format = '%d-%m'))
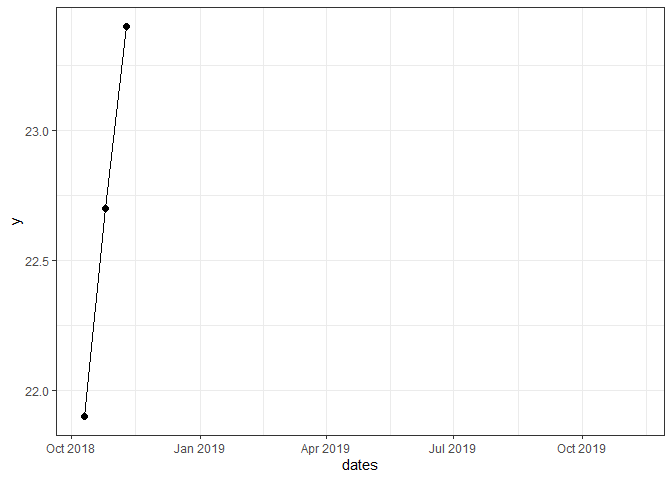
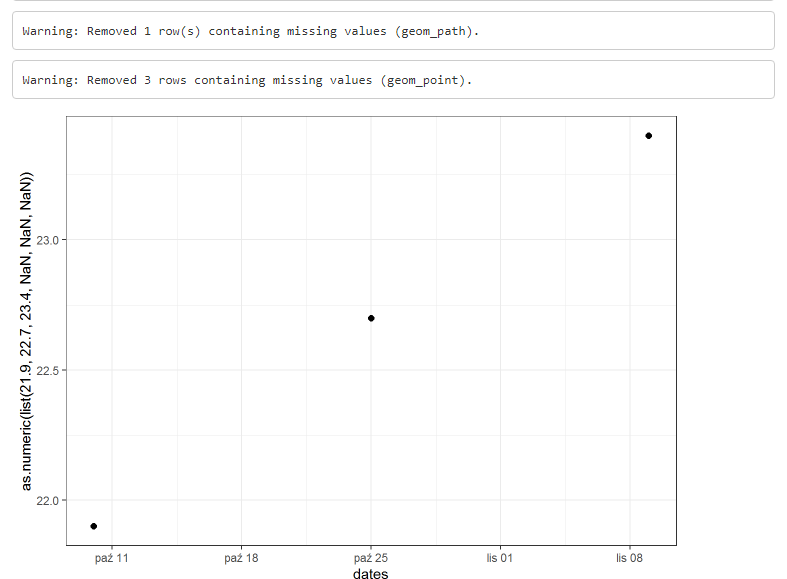
chart1 <- ggplot(data = df1, aes(x = dates, y = as.numeric(list(21.900,22.700,23.400,NA,NA,NA))), group = 1)+
geom_line(size = 0.5) + geom_point(size = 2) + theme_bw()
chart1
Result:
If I replace NA values with some random values, everything works fine.
For sure this is some stupid problem but I cannot solve it. I already spent a lot of time with this issue.