Hi,
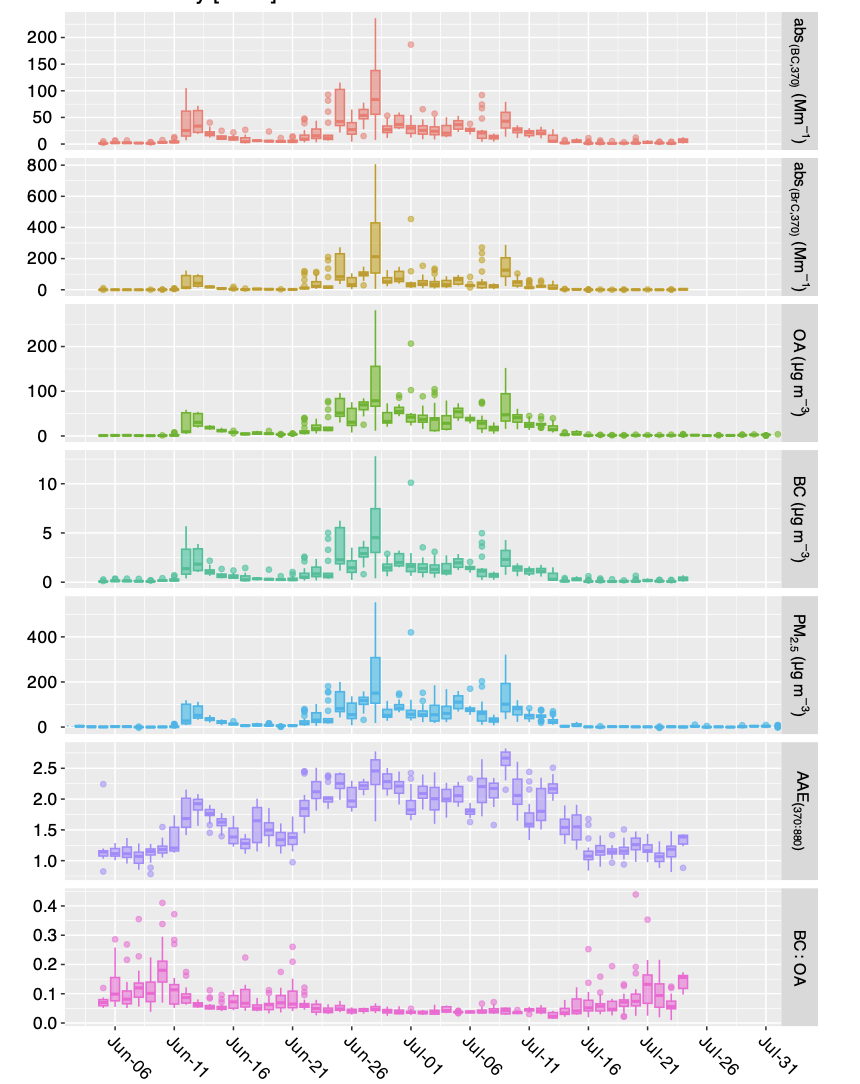
I want to re-write the units of each variable (see the plot) within the plot panel box.
currently, the units are on the facet strip theme on the right side of the plot.
the code is
names(AE33_NCORE_hourly)
AE33_NCORE_hourly %>%
  distinct(TheTime, .keep_all= TRUE) %>%   # remove duplicate rows based on header
  mutate(day = floor_date(TheTime,'day')) %>%
  relocate(day) %>%
  select(-TheTime) %>%
  mutate(ratio_BC_OA = ifelse(ratio_BC_OA > 0.5, NA, ratio_BC_OA)) %>%
  select(day,BC_abs_370,BrC_abs_370,OA,conc_880_BC6,pm2p5,AAE_370_880,ratio_BC_OA) %>%
  melt(id.vars=1:1)  -> AE33_NCORE_daily_june_july_a

levels(AE33_NCORE_daily_june_july_a$variable) <- c("abs[`(BC,370)`] ~ '('*Mm^-1*')'",
                                                 "abs[`(BrC,370)`] ~ '('*Mm^-1*')'",
                                                 "OA ~ '('*mu*g~m^-3*')'",
                                                 "BC ~ '('*mu*g~m^-3*')'",
                                                 "PM[2.5] ~ '('*mu*g~m^-3*')'",
                                                 "AAE[(370:880)]",
                                                 "BC:OA")

AE33_NCORE_daily_june_july_a %>%
  ggplot(aes(x=day, y=value, color=variable, group = day, fill = variable,alpha=0.2)) +
  geom_boxplot(notch = F) +
  xlab("Local Time") +
  ylab("") +
  labs(title = "")+
  # ylim(0,80) +
  theme(legend.title=element_blank()) +
  theme(legend.text=element_text(size=rel(0.8)))+
  theme(legend.position="none")+
  # theme(legend.position = c(0.8, 0.2)) +
  theme(axis.title = element_text(face="plain",size=14,color="black"),
        axis.text=element_text(size=12,face="plain", color="black"),
        axis.title.x = element_text(vjust=0.1),
        axis.text.y=element_text(hjust=0.5),
        axis.text.x=element_text(hjust=0.0, angle = -45),
        plot.title = element_text(size=16)) +
  theme(strip.text = element_text(size=11, color="black"))+
  facet_grid(variable ~., switch = "x", scales = "free_y", space = "free_x",
             labeller = label_parsed) +
  scale_x_datetime(expand=c(0,0),
                   breaks = date_breaks("5 days"),
                   labels = date_format("%b-%d"),
                   limits = as.POSIXct(c("2022-06-01 10:00:00", "2022-07-31 23:00:00")))+
  annotate("text", x = as.POSIXct("2022-06-05"), y = Inf, label = "Mm^-1", hjust = -0.1, vjust = 1.5, size = 4)
Here I tried to use the
annotate to rewrite the unit in the plot box,
annotate("text", x = as.POSIXct("2022-06-05"), y = Inf, label = "Mm^-1", hjust = -0.1, vjust = 1.5, size = 4)
But, after applying annotate, the unit, for example, Mm^-1 is showing to each variable panel, as you can see in the attached plot.

So, I want to write the unit Mm^-1 for 1st and 2nd panels and
the unit ugm-3 is for 3 (OA), 4(BC), and 5(pm) panels and
5 and 6 panels are free from units.
Thanks
