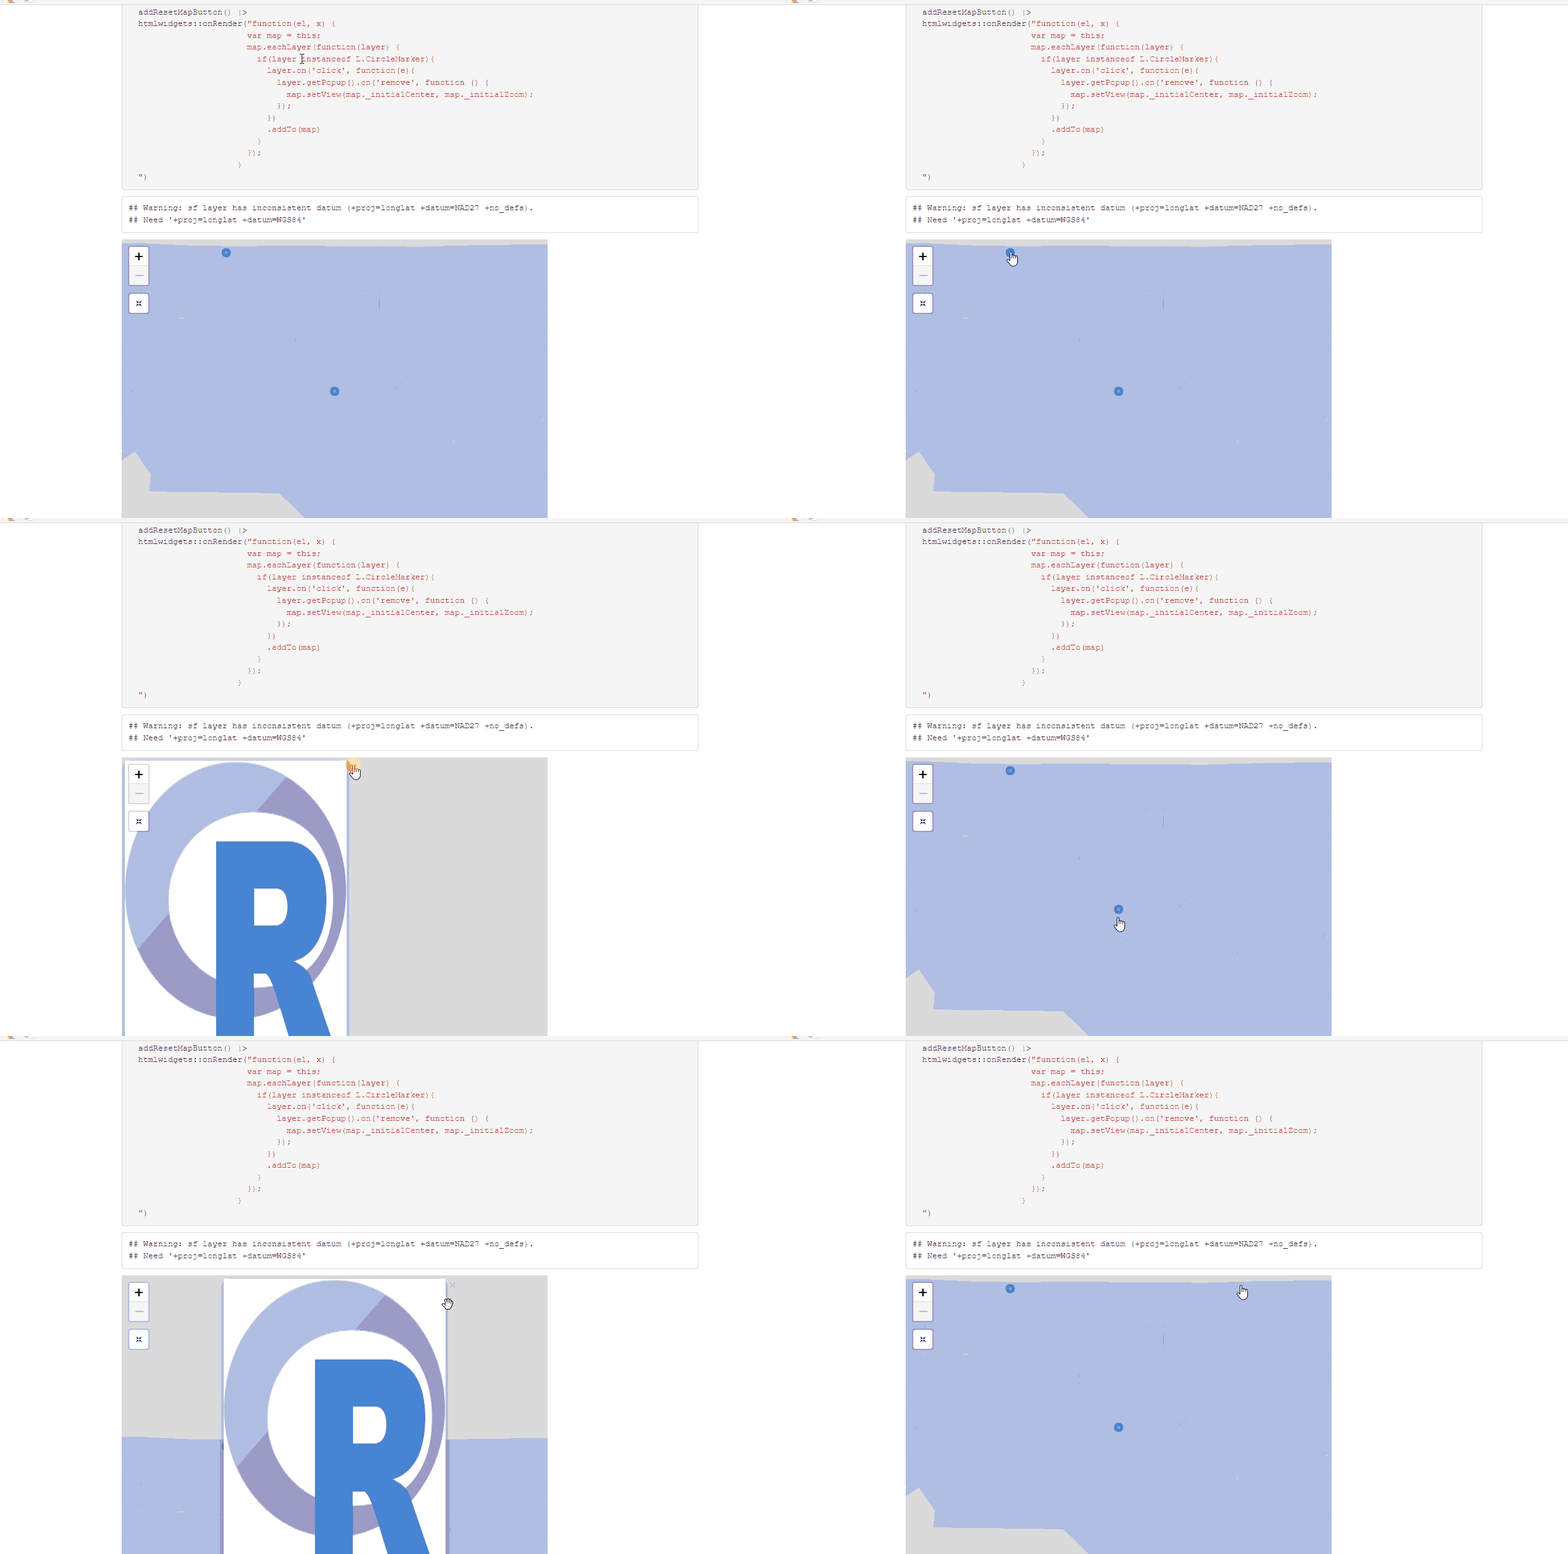
I have a Crosstalk Rmd file with a leaflet map of a state that includes circle markers with associated popup images (plots) that works as expected. However, the map often pans past the state borders to accommodate the vertical popups, forcing the user to drag the map back or click the reset button to again see the other markers.
As in the example below, the problem is most pronounced for points near the upper state line.
library(leaflet)
#> Warning: package 'leaflet' was built under R version 4.2.3
library(leafpop)
library(leaflet.extras)
#> Warning: package 'leaflet.extras' was built under R version 4.2.2
library(sf)

# marker coordinates
x <- data.frame(lng = c(-80.136153, -79.193958),
                lat = c(36.50004, 35.529021))

pic <- 'https://www.r-project.org/logo/Rlogo.png'

# state data
nc <- st_read(system.file("shape/nc.shp", package="sf"), quiet = T)

leaflet(nc,
        options = leafletOptions(
  minZoom = 8,
  maxZoom = 10,
)) |>
  addPolygons(
    weight = .1) |>
  addCircleMarkers (data = x,
    lng = ~lng,
    lat = ~lat,
    radius =  5,
    popup = popupImage(pic, width = 350, height = 471),
    popupOptions =
      popupOptions(keepInView = TRUE,
                   autoPan = TRUE)) |>
  setView(lng = -79.193958,
          lat = 35.529021, 6) |>
  addResetMapButton()
I unsuccessfully tried incorporating the following suggestion that uses javascript from a post on a similar RStudio leaflet issue
htmlwidgets::onRender("
    function() {
      var myMap = this;
      myMap.invalidateSize();
    }")
and similar javascript solutions from SO.
Knowing javascript would be helpful to better experiment with those solutions and to understand the leaflet docs on popups, but I'm not there yet.
Is there a way to do this within leaflet in R I'm missing? Alternately, is there a proper way to accomplish it through htmlwidgets::onRender()?
