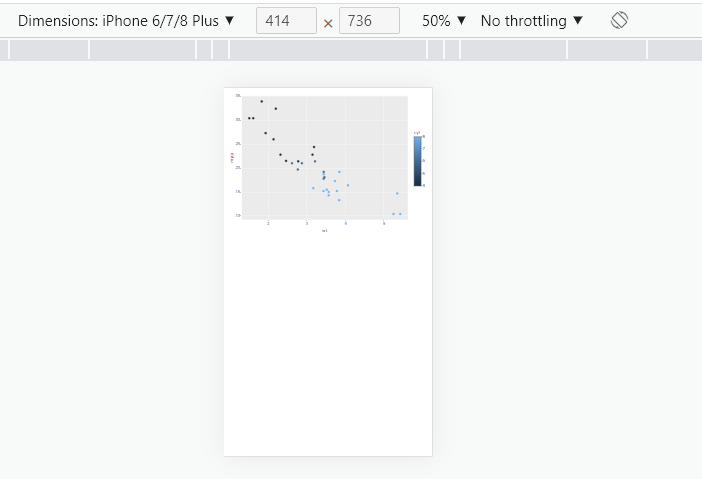
I ran you code and got a correctly adjusted plot
---
output: html_document
---

```{r, echo=FALSE, warning=FALSE, message=FALSE}

library(plotly)
library(ggplot2)

static <- ggplot(mtcars, aes(x = wt, y = mpg, color = cyl)) +
          geom_point()

ggplotly(static)
```
