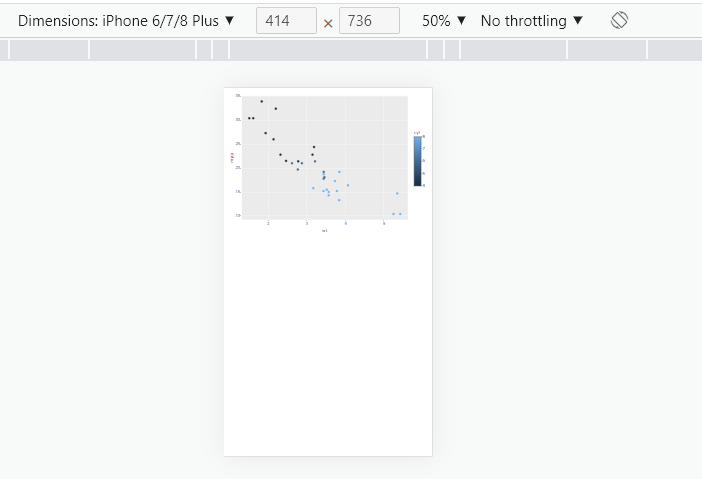
I am trying to generate a fluid and responsive plotly output in a Rmarkdown document as I normally get in shiny apps, but by default the output overflow in small screens.
I need to know if I have to include any dependency to my Rmarkdown document, or activate any chunk option in order to make it work properly.
See the example below.
Shiny app
library(shiny)
library(plotly)
library(ggplot2)

ui <- fluidPage(
  plotlyOutput("plot")
)

server <- function(input, output, session) {
  output$plot <- renderPlotly({
      static <- ggplot(mtcars, aes(x = wt, y = mpg, color = cyl)) +
          geom_point()

      ggplotly(static)
  })
}

shinyApp(ui, server)
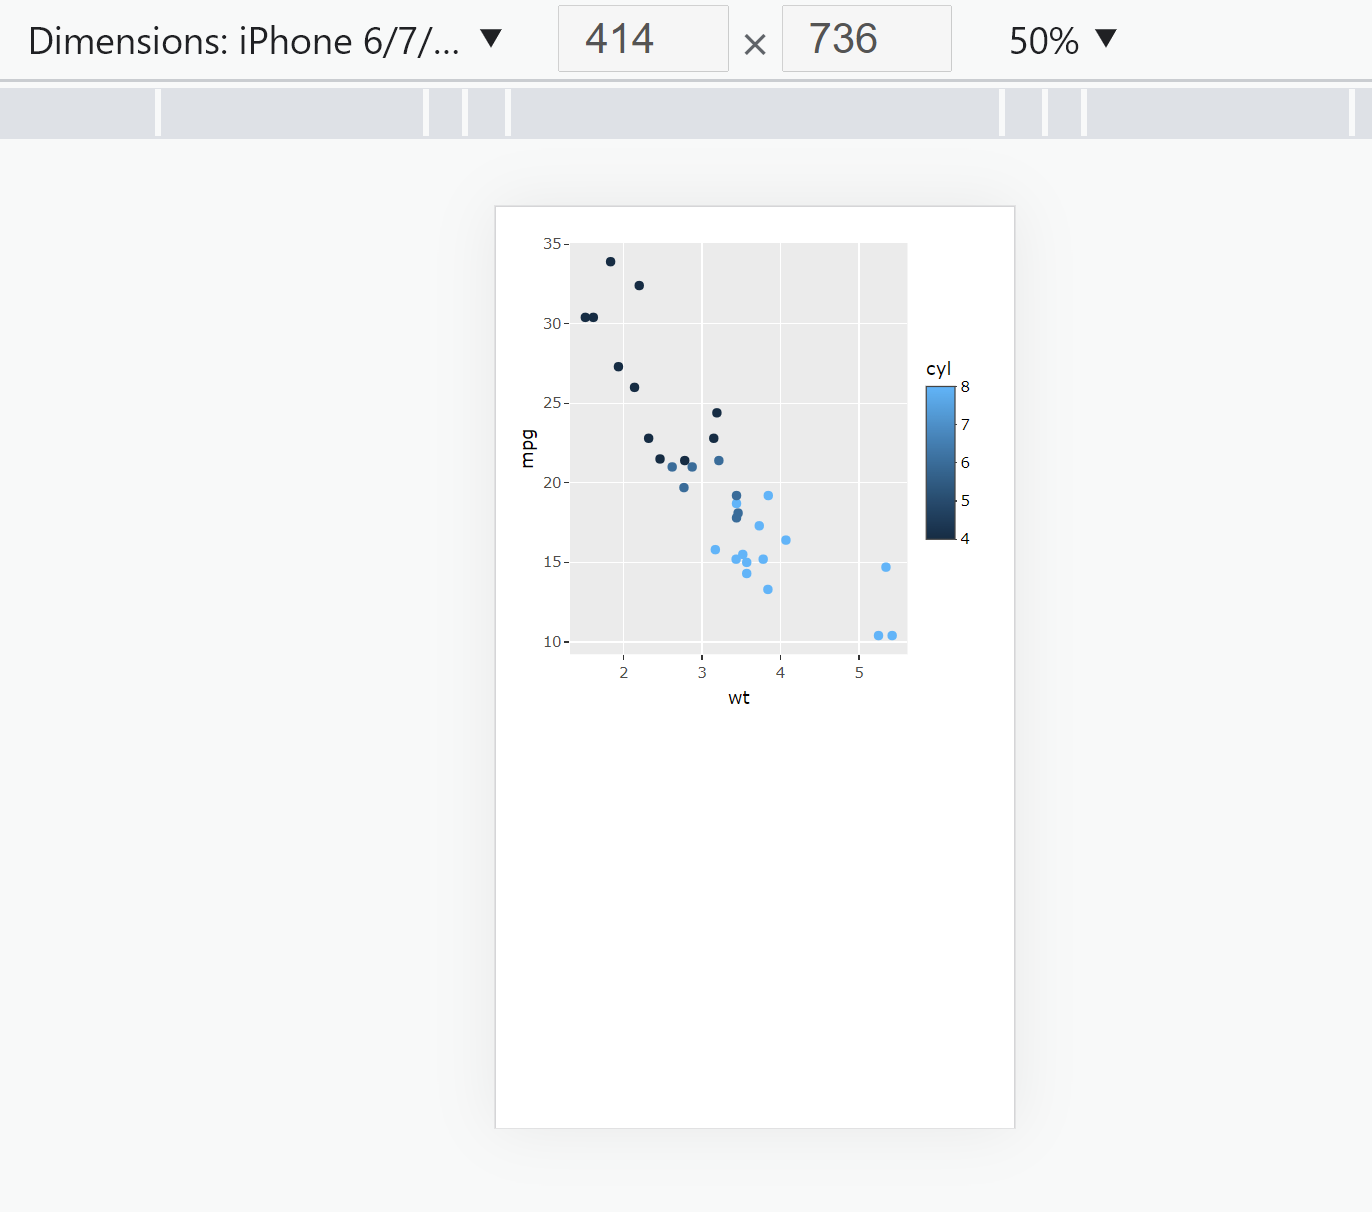
The output is a html document with a responsive plot:
Rmarkdown html document
---
output: html_document
---

```{r, echo=FALSE, warning=FALSE, message=FALSE}

library(plotly)
library(ggplot2)

static <- ggplot(mtcars, aes(x = wt, y = mpg, color = cyl)) +
          geom_point()

      ggplotly(static)
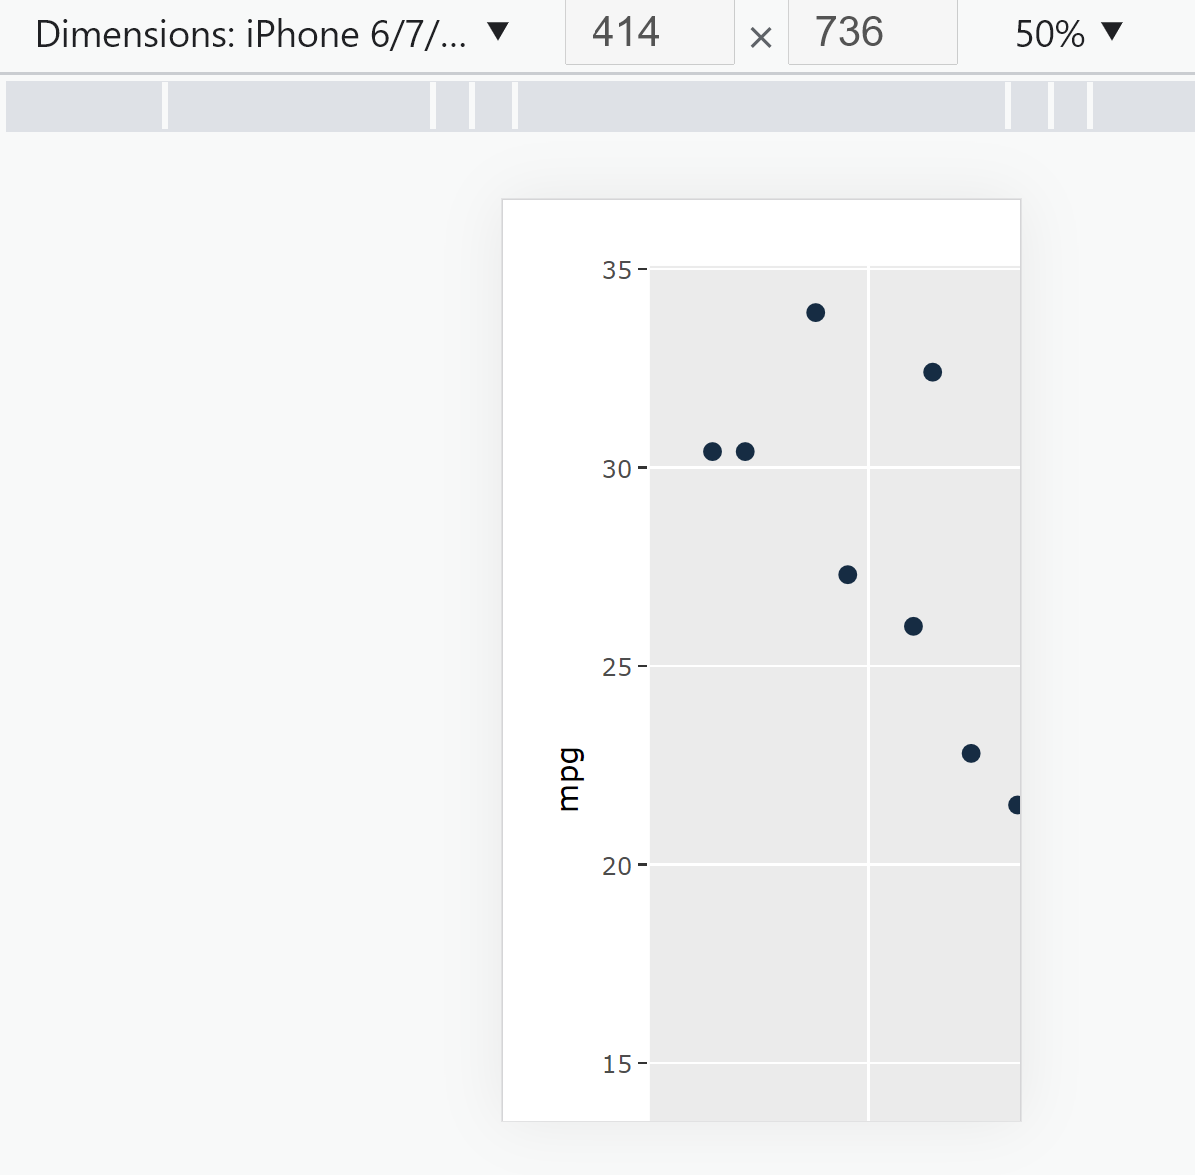
The output is also a html document but without a responsive plot
Thanks in advance for your attention.