replace values in a dataframe based on a lookup from a list

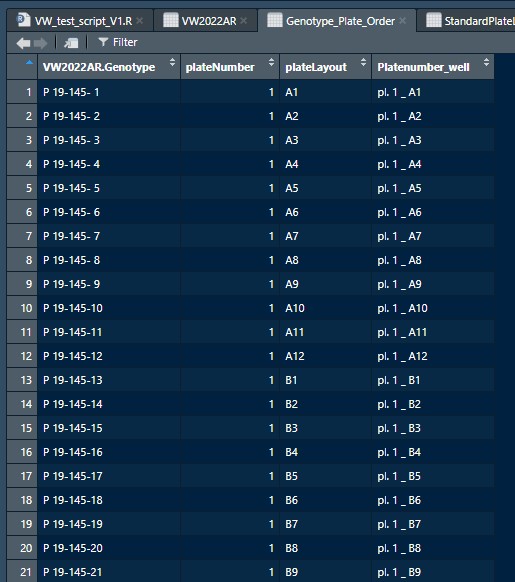
I have a list called Genotype_Plate_Order in which thousands of samples are listed. Each sample has a sample name (VW2022AR.Genotype; example P 19-145- 01) and a sample position (Platenumber_well).
One plate holds 96 different wells, from A1 till H12. The combination of plate number and well number is unique. Since there are thousands of samples in this list, there are also many plate numbers of course.
Below are the first 6 rows of this dataframe.

VW2022AR.Genotype plateNumber plateLayout Platenumber_well
1       P 19-145- 1           1          A1       pl. 1 _ A1
2       P 19-145- 2           1          A2       pl. 1 _ A2
3       P 19-145- 3           1          A3       pl. 1 _ A3
4       P 19-145- 4           1          A4       pl. 1 _ A4
5       P 19-145- 5           1          A5       pl. 1 _ A5
6       P 19-145- 6           1          A6       pl. 1 _ A6

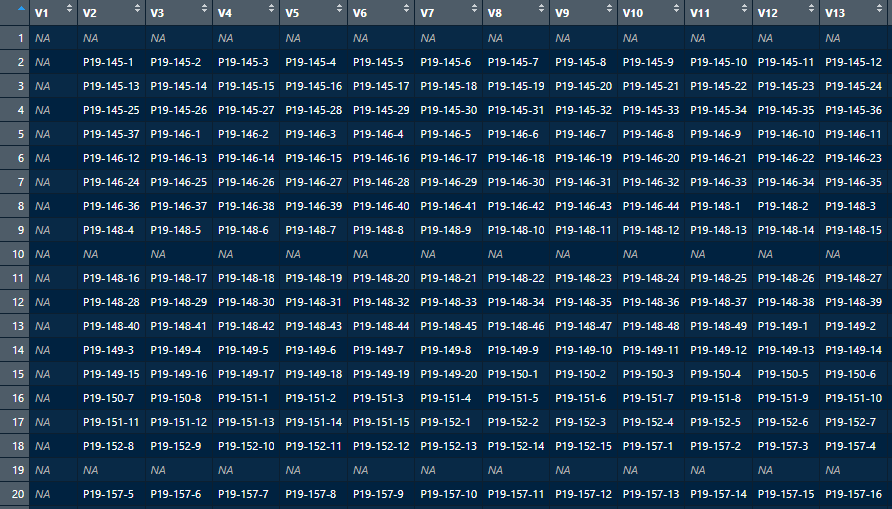
Top-view of this list with samples:

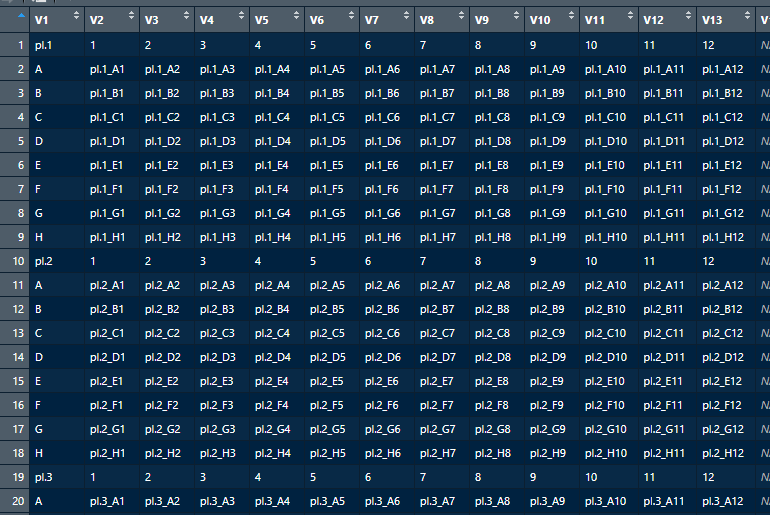
The vector "Platenumber_well" needs to be looked up in the dataframe 'StandardPlateLayout'. See a head() example and printscreen below.

 V1      V2      V3      V4      V5      V6      V7      V8      V9     V10      V11      V12      V13 V14 V15 V16 V17
1  pl.1       1       2       3       4       5       6       7       8       9       10       11       12  NA  NA  NA  NA
2     A pl.1_A1 pl.1_A2 pl.1_A3 pl.1_A4 pl.1_A5 pl.1_A6 pl.1_A7 pl.1_A8 pl.1_A9 pl.1_A10 pl.1_A11 pl.1_A12  NA  NA  NA  NA
3     B pl.1_B1 pl.1_B2 pl.1_B3 pl.1_B4 pl.1_B5 pl.1_B6 pl.1_B7 pl.1_B8 pl.1_B9 pl.1_B10 pl.1_B11 pl.1_B12  NA  NA  NA  NA
4     C pl.1_C1 pl.1_C2 pl.1_C3 pl.1_C4 pl.1_C5 pl.1_C6 pl.1_C7 pl.1_C8 pl.1_C9 pl.1_C10 pl.1_C11 pl.1_C12  NA  NA  NA  NA
5     D pl.1_D1 pl.1_D2 pl.1_D3 pl.1_D4 pl.1_D5 pl.1_D6 pl.1_D7 pl.1_D8 pl.1_D9 pl.1_D10 pl.1_D11 pl.1_D12  NA  NA  NA  NA
6     E pl.1_E1 pl.1_E2 pl.1_E3 pl.1_E4 pl.1_E5 pl.1_E6 pl.1_E7 pl.1_E8 pl.1_E9 pl.1_E10 pl.1_E11 pl.1_E12  NA  NA  NA  NA
7     F pl.1_F1 pl.1_F2 pl.1_F3 pl.1_F4 pl.1_F5 pl.1_F6 pl.1_F7 pl.1_F8 pl.1_F9 pl.1_F10 pl.1_F11 pl.1_F12  NA  NA  NA  NA
8     G pl.1_G1 pl.1_G2 pl.1_G3 pl.1_G4 pl.1_G5 pl.1_G6 pl.1_G7 pl.1_G8 pl.1_G9 pl.1_G10 pl.1_G11 pl.1_G12  NA  NA  NA  NA
9     H pl.1_H1 pl.1_H2 pl.1_H3 pl.1_H4 pl.1_H5 pl.1_H6 pl.1_H7 pl.1_H8 pl.1_H9 pl.1_H10 pl.1_H11 pl.1_H12  NA  NA  NA  NA
10 pl.2       1       2       3       4       5       6       7       8       9       10       11       12  NA  NA  NA  NA
11    A pl.2_A1 pl.2_A2 pl.2_A3 pl.2_A4 pl.2_A5 pl.2_A6 pl.2_A7 pl.2_A8 pl.2_A9 pl.2_A10 pl.2_A11 pl.2_A12  NA  NA  NA  NA
12    B pl.2_B1 pl.2_B2 pl.2_B3 pl.2_B4 pl.2_B5 pl.2_B6 pl.2_B7 pl.2_B8 pl.2_B9 pl.2_B10 pl.2_B11 pl.2_B12  NA  NA  NA  NA

This 'StandardPlateLayout' dataframe is a standard excel dataframe that explaines the order of samples in a collection box that is used for sample-collections. The dataframe is hundreds of plates (pl.##) long.

The objective is: The vector "Platenumber_well" from the dataframe 'Genotype_Plate_Order' needs to be looked up in the dataframe 'StandardPlateLayout'.
When true, it needs to be overwritten by the sample-name from the vector 'VW2022AR.Genotype' from 'Genotype_Plate_Order'.

I came up so far with the code below but somehow it gives me all NA. If someone has any suggestion, it would be very appreciated.

StandardPlateLayout[] <- lapply(
StandardPlateLayout, function(x) Genotype_Plate_Order$VW2022AR.Genotype[match(x,
Genotype_Plate_Order$Platenumber_well)])

I'm not sure I understand exactly what you're trying to achieve. And if I do, you're doing something more complicated than needed.

From the looks of it, you loaded both Genotype_Plate_Order and StandardPlateLayout as dataframes, getting something like:

Genotype_Plate_Order  <- read.csv(text = "VW2022AR.Genotype, plateNumber, plateLayout, Platenumber_well
1       P 19-145- 1,           1,          A1,       pl. 1 _ A1
2       P 19-145- 2,           1,          A2,       pl. 1 _ A2
3       P 19-145- 3,           1,          A3,       pl. 1 _ A3
4       P 19-145- 4,           1,          A4,       pl. 1 _ A4
5       P 19-145- 5,           1,          A5,       pl. 1 _ A5
6       P 19-145- 6,           1,          A6,       pl. 1 _ A6",
header = TRUE)


StandardPlateLayout<-read.csv(text=",V1,V2,V3,V4,V5,V6,V7,V8,V9,V10,V11,V12,V13,V14,V15,V16,V17
1,pl.1,1,2,3,4,5,6,7,8,9,10,11,12,NA,NA,NA,NA
2,A,pl.1_A1,pl.1_A2,pl.1_A3,pl.1_A4,pl.1_A5,pl.1_A6,pl.1_A7,pl.1_A8,pl.1_A9,pl.1_A10,pl.1_A11,pl.1_A12,NA,NA,NA,NA
3,B,pl.1_B1,pl.1_B2,pl.1_B3,pl.1_B4,pl.1_B5,pl.1_B6,pl.1_B7,pl.1_B8,pl.1_B9,pl.1_B10,pl.1_B11,pl.1_B12,NA,NA,NA,NA
4,C,pl.1_C1,pl.1_C2,pl.1_C3,pl.1_C4,pl.1_C5,pl.1_C6,pl.1_C7,pl.1_C8,pl.1_C9,pl.1_C10,pl.1_C11,pl.1_C12,NA,NA,NA,NA
5,D,pl.1_D1,pl.1_D2,pl.1_D3,pl.1_D4,pl.1_D5,pl.1_D6,pl.1_D7,pl.1_D8,pl.1_D9,pl.1_D10,pl.1_D11,pl.1_D12,NA,NA,NA,NA
6,E,pl.1_E1,pl.1_E2,pl.1_E3,pl.1_E4,pl.1_E5,pl.1_E6,pl.1_E7,pl.1_E8,pl.1_E9,pl.1_E10,pl.1_E11,pl.1_E12,NA,NA,NA,NA
7,F,pl.1_F1,pl.1_F2,pl.1_F3,pl.1_F4,pl.1_F5,pl.1_F6,pl.1_F7,pl.1_F8,pl.1_F9,pl.1_F10,pl.1_F11,pl.1_F12,NA,NA,NA,NA
8,G,pl.1_G1,pl.1_G2,pl.1_G3,pl.1_G4,pl.1_G5,pl.1_G6,pl.1_G7,pl.1_G8,pl.1_G9,pl.1_G10,pl.1_G11,pl.1_G12,NA,NA,NA,NA
9,H,pl.1_H1,pl.1_H2,pl.1_H3,pl.1_H4,pl.1_H5,pl.1_H6,pl.1_H7,pl.1_H8,pl.1_H9,pl.1_H10,pl.1_H11,pl.1_H12,NA,NA,NA,NA
10,pl.2,1,2,3,4,5,6,7,8,9,10,11,12,NA,NA,NA,NA
11,A,pl.2_A1,pl.2_A2,pl.2_A3,pl.2_A4,pl.2_A5,pl.2_A6,pl.2_A7,pl.2_A8,pl.2_A9,pl.2_A10,pl.2_A11,pl.2_A12,NA,NA,NA,NA
12,B,pl.2_B1,pl.2_B2,pl.2_B3,pl.2_B4,pl.2_B5,pl.2_B6,pl.2_B7,pl.2_B8,pl.2_B9,pl.2_B10,pl.2_B11,pl.2_B12,NA,NA,NA,NA
",header=TRUE)


Genotype_Plate_Order
#>     VW2022AR.Genotype plateNumber  plateLayout  Platenumber_well
#> 1 1       P 19-145- 1           1           A1        pl. 1 _ A1
#> 2 2       P 19-145- 2           1           A2        pl. 1 _ A2
#> 3 3       P 19-145- 3           1           A3        pl. 1 _ A3
#> 4 4       P 19-145- 4           1           A4        pl. 1 _ A4
#> 5 5       P 19-145- 5           1           A5        pl. 1 _ A5
#> 6 6       P 19-145- 6           1           A6        pl. 1 _ A6
StandardPlateLayout
#>     X   V1      V2      V3      V4      V5      V6      V7      V8      V9
#> 1   1 pl.1       1       2       3       4       5       6       7       8
#> 2   2    A pl.1_A1 pl.1_A2 pl.1_A3 pl.1_A4 pl.1_A5 pl.1_A6 pl.1_A7 pl.1_A8
#> 3   3    B pl.1_B1 pl.1_B2 pl.1_B3 pl.1_B4 pl.1_B5 pl.1_B6 pl.1_B7 pl.1_B8
#> 4   4    C pl.1_C1 pl.1_C2 pl.1_C3 pl.1_C4 pl.1_C5 pl.1_C6 pl.1_C7 pl.1_C8
#> 5   5    D pl.1_D1 pl.1_D2 pl.1_D3 pl.1_D4 pl.1_D5 pl.1_D6 pl.1_D7 pl.1_D8
#> 6   6    E pl.1_E1 pl.1_E2 pl.1_E3 pl.1_E4 pl.1_E5 pl.1_E6 pl.1_E7 pl.1_E8
#> 7   7    F pl.1_F1 pl.1_F2 pl.1_F3 pl.1_F4 pl.1_F5 pl.1_F6 pl.1_F7 pl.1_F8
#> 8   8    G pl.1_G1 pl.1_G2 pl.1_G3 pl.1_G4 pl.1_G5 pl.1_G6 pl.1_G7 pl.1_G8
#> 9   9    H pl.1_H1 pl.1_H2 pl.1_H3 pl.1_H4 pl.1_H5 pl.1_H6 pl.1_H7 pl.1_H8
#> 10 10 pl.2       1       2       3       4       5       6       7       8
#> 11 11    A pl.2_A1 pl.2_A2 pl.2_A3 pl.2_A4 pl.2_A5 pl.2_A6 pl.2_A7 pl.2_A8
#> 12 12    B pl.2_B1 pl.2_B2 pl.2_B3 pl.2_B4 pl.2_B5 pl.2_B6 pl.2_B7 pl.2_B8
#>        V10      V11      V12      V13 V14 V15 V16 V17
#> 1        9       10       11       12  NA  NA  NA  NA
#> 2  pl.1_A9 pl.1_A10 pl.1_A11 pl.1_A12  NA  NA  NA  NA
#> 3  pl.1_B9 pl.1_B10 pl.1_B11 pl.1_B12  NA  NA  NA  NA
#> 4  pl.1_C9 pl.1_C10 pl.1_C11 pl.1_C12  NA  NA  NA  NA
#> 5  pl.1_D9 pl.1_D10 pl.1_D11 pl.1_D12  NA  NA  NA  NA
#> 6  pl.1_E9 pl.1_E10 pl.1_E11 pl.1_E12  NA  NA  NA  NA
#> 7  pl.1_F9 pl.1_F10 pl.1_F11 pl.1_F12  NA  NA  NA  NA
#> 8  pl.1_G9 pl.1_G10 pl.1_G11 pl.1_G12  NA  NA  NA  NA
#> 9  pl.1_H9 pl.1_H10 pl.1_H11 pl.1_H12  NA  NA  NA  NA
#> 10       9       10       11       12  NA  NA  NA  NA
#> 11 pl.2_A9 pl.2_A10 pl.2_A11 pl.2_A12  NA  NA  NA  NA
#> 12 pl.2_B9 pl.2_B10 pl.2_B11 pl.2_B12  NA  NA  NA  NA

Created on 2023-03-30 with reprex v2.0.2

You can check that yours are also data.frames with:

class(Genotype_Plate_Order)
#> [1] "data.frame"
class(StandardPlateLayout)
#> [1] "data.frame"

For StandardPlateLayout, you actually don't care about the columns, and are only interested to look at the individual elements. So it'll be easier if it's a vector:

vector_StandardPlateLayout <- unlist(StandardPlateLayout)
class(vector_StandardPlateLayout)
#> [1] "character"

So at this point, you can simply use %in% to check whether a given Platenumber_well is present or not in the vector:

Genotype_Plate_Order$Platenumber_well %in% vector_StandardPlateLayout
#> [1] FALSE FALSE FALSE FALSE FALSE FALSE
gsub(" ", "", Genotype_Plate_Order$Platenumber_well) %in% vector_StandardPlateLayout
#> [1] TRUE TRUE TRUE TRUE TRUE TRUE

(I needed the gsub() to remove the spaces, as, the way your data.frames are pasted above, Platenumber_well has spaces that StandardPlateLayout doesn't have)

Then you can do more complex things, e.g. ifelse(Genotype_Plate_Order$Platenumber_well %in% vector_StandardPlateLayout, Genotype_Plate_Order$VW2022AR.Genotype, Genotype_Plate_Order$Platenumber_well).

Dear AlexisW,

Thank you very much for your reply and suggestions. Especially your comment on the spaces!

I was not aware that the lookup dataset and the platelayout dataset had space-differences between them. This was not intended. When removing these spaces, the function I innitially wrote worked!

StandardPlateLayout[] <- lapply(StandardPlateLayout, function(x) Genotype_Plate_Order_nospaces$VW2022AR.Genotype[match(x, Genotype_Plate_Order_nospaces$Platenumber_well)])

Below you can see the result, which is almost exactly as I want it to be, because the order of the layout needs to stay intact (it is an order to collect samples, which is done per coordinate: A1, A2, A3, etc...).

Now the platelayout can be printed and used in the field to collect the correct samples (eg P19-145-1) and put them in the correct sample tube.

I do have one question though and maybe you are able to help me. The match function also replaced the coordinates that are needed for the print overview. Since these were not present in the lookup-list (Genotype_Plate_Order), they got returned as NA. Is there a way to prevent unmatched values being called NA?

Thanks a lot!!

Maarten

Standard platelayout before lookup:

Standard platelayout AFTER lookup:

Great! I went with the lazy route rewriting my own function rather than trying to understand what someone else wrote : )

Oh I had not well understood why the specific layout mattered. Makes sense.

Hmm, that's not the most standard use of R (which in my opinion would be to do all the processing in a normal, two-columns data.frame, then print it out with a plate layout, regenerating the labels in the process). But in your case that might be easy enough to just use what you already have.

You can check the nomatch= argument of match(), but I don't think it works for you (just allows you to use a value other than NA). I think the easiest would be to replace the NAs after the fact with the original values:

Genotype_Plate_Order_nospaces <- Genotype_Plate_Order
Genotype_Plate_Order_nospaces$Platenumber_well <- gsub(" ", "", Genotype_Plate_Order$Platenumber_well)

StandardPlateLayout_replaced <- StandardPlateLayout
StandardPlateLayout_replaced[] <- lapply(StandardPlateLayout, function(x) Genotype_Plate_Order_nospaces$VW2022AR.Genotype[match(x, Genotype_Plate_Order_nospaces$Platenumber_well)])

StandardPlateLayout_replaced[is.na(StandardPlateLayout_replaced)] <- StandardPlateLayout[is.na(StandardPlateLayout_replaced)]

If you're curious, that's how I would approach your problem, using packages from the tidyverse (you can add a library(tidyverse) at the start and that automatically includes {stringr}, {dplyr}, and{tidyr}):

Genotype_Plate_Order |>
  dplyr::mutate(plateLayout = stringr::str_remove_all(plateLayout, " "),
                VW2022AR.Genotype = stringr::str_remove_all(VW2022AR.Genotype, " "),
                Platenumber_well = stringr::str_remove_all(Platenumber_well, " ")) |>
  tidyr::extract(plateLayout,
                 into = c("plateRow", "plateColumn"),
                 regex = "^([A-F])([0-9]{1,2})$",
                 remove = FALSE) |>
  tidyr::pivot_wider(id_cols = c(plateNumber, plateRow),
                     names_from = "plateColumn",
                     values_from = "VW2022AR.Genotype") |>
  dplyr::group_by(plateNumber) |>
  dplyr::group_split()

Briefly, mutate(str_remove_all()) are to remove all these extra spaces from the 3 columns of interest. With extract() I separate the plate coordinate into a row and column, for this I use a regex. pivot_wider() transforms the dataframe with one row per well into a dataframe with one row per plateRow, so it has the desired shape. Finally, group_by() and group_split() splits your single dataframe into a list of dataframes, one for each plate. You can them print the elements of the list separately etc.

This approach is much more like the standard R way to think about data, which makes it easier to extend or to find problems with. Of course your current approach works too!

Dear AlexisW,

Your is.na function does the trick so simple. I've spend some time trying to figure out how to replace the NA's back into the original values. But I wasn't able to get it done.

You must know, I've just started using Rstudio and have no alternative script-writing experience, it's all new to me. I used youtube to get started with the basics and now I am 'googling' my way around to get this pipeline to work. I a few weeks time I will start a course 'R-introduction' at the dutch 'Open University' (online learning) and hopefully get some better basic knowledge.

Since you took some of your time to help me, I think is nice to give you some context information about my topic.

The pipeline I am building now is one we already have in Excel, which I build a few years ago. We are a plant DNA- laboratory and receive from our planning-department a excel-matrix of ~15.000 genotypes which need to be tested in the laboratory with ~20 different DNA- markers. Every single genotype needs to be potentially tested with a different selection of these 20 markers. Making a difficult puzzle for the 'lab-people'.

The excel I made a few years ago, puts all the genotypes into a sampling order (this order matches exactly the order of a 96-well sampling box, which can be printed and used in field for correct samling of the plant-tissue). This is the part where you helped me.
Next the excel tests each 96-well plate (per DNA marker) if more then 60% of the genotypes need to be tested with this DNA-test. If so, Excel puts this plate for this specific DNA-test into the list to 'simply' test the whole plate with this marker (there is no need to select the specific plants that need to be tested. For convenience, just test them all).
If a plate drops below the 60% for a given DNA marker, Excel select which ROWS (A / H) contain genotypes that need to be tested. If a row contains a genotype to be tested, Excel puts this row in a separate list to test markers per row.
(the lab can not easily test single genotypes, meaning single well's per plate. We can only test a full plate or a row of well's. So we always also test genotypes that don't need to be tested. It was calculated that 60% is the best threshold for a good ratio between 'easy full-plate-testing' and cost-efficiency).

in this way, a 'easy-to-follow' planning is produced that also minimizes the risk of mix-up in the lab.

This Excel sheet works fine in principle, but there are some drawbacks. It is too large with too many formula's, making it very slow. It is also user-unfriendly to add more DNA-markers.

Since nobody in our company had Rstudio knowledge and I was thinking of getting trained to get more skills, I took this 'excel-pipeline' as my first 'training-object'.

Your help here was great and I can't say thank you enough.

I have the first part of the pipeline finished. I will start working on the next, which is the DNA-test planning.

The final part is to read the lab-results back into the original matrix.

Thanks a lot and we might speak again!

Best regards,
Maarten

That's how we all started!

Indeed, from your description of the problem, it feels like R could be a good way to make automation more robust. Excel tends to be great for simple tasks, but really hard to follow when things get complicated.

Proper training is always a good idea to start learning, then there are also a lot of resources online, what I used in my answer is largely described in the r4ds book. I'm afraid in any case getting good at R is like everything else, it takes time and practice.

This topic was automatically closed 7 days after the last reply. New replies are no longer allowed.

If you have a query related to it or one of the replies, start a new topic and refer back with a link.