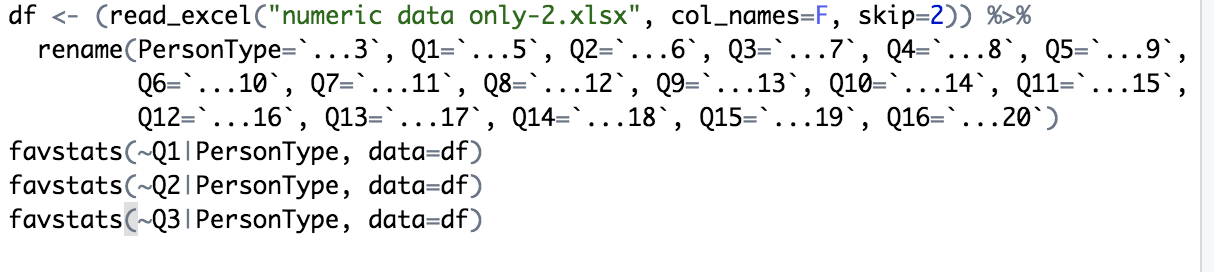
So basically I have a big dataset imported from excel. It consists of survey responses (ratings from 1-5 for 127 different questions. I need to pull favstats for each one, and I don't know how to do that without manually running it for each one. What I've done so far is renamed each row after the question number
And then after doing that for a bunch of the questions, I just run favstats on each one individually like this:
This would work, but realistically I can't sit here and run this for all 127 of the questions. Is there a way for me to run it on all of the questions with just one command?
I have never used the mosaic package, so the last step below is how I think it will work. It throws an error in my code because I do not have the package. The code before that shows how to rename your columns efficiently and how to reshape the data so that favstats can calculate statistics for all of the questions at once. I hope I am not leading you astray guessing at how favstats works.
DF <- data.frame(PersonType = c("A", "B", "A", "B"),
                 BadName1 = runif(4, 0, 5),
                 BadName2 = runif(4, 0, 5),
                 BadName3 = runif(4, 0, 5),
                 BadName4 = runif(4, 0, 5),
                 BadName5 = runif(4, 0, 5))
DF
#>   PersonType  BadName1  BadName2 BadName3 BadName4  BadName5
#> 1          A 4.4328198 2.5343342 4.826156 2.935417 1.2146830
#> 2          B 0.5161261 0.4782906 4.405942 2.942268 2.9444149
#> 3          A 0.3700707 2.6378352 2.928798 3.132720 0.4250004
#> 4          B 2.0910784 1.4851919 1.051851 4.807708 4.0694807
#How to rename several columns
colnames(DF)[2:6] <- paste0("Q", 1:5)
DF
#>   PersonType        Q1        Q2       Q3       Q4        Q5
#> 1          A 4.4328198 2.5343342 4.826156 2.935417 1.2146830
#> 2          B 0.5161261 0.4782906 4.405942 2.942268 2.9444149
#> 3          A 0.3700707 2.6378352 2.928798 3.132720 0.4250004
#> 4          B 2.0910784 1.4851919 1.051851 4.807708 4.0694807
library(tidyr)
DFtall <- pivot_longer(DF, cols=Q1:Q5, names_to = "Question")
DFtall
#> # A tibble: 20 x 3
#>    PersonType Question value
#>    <fct>      <chr>    <dbl>
#>  1 A          Q1       4.43
#>  2 A          Q2       2.53
#>  3 A          Q3       4.83
#>  4 A          Q4       2.94
#>  5 A          Q5       1.21
#>  6 B          Q1       0.516
#>  7 B          Q2       0.478
#>  8 B          Q3       4.41
#>  9 B          Q4       2.94
#> 10 B          Q5       2.94
#> 11 A          Q1       0.370
#> 12 A          Q2       2.64
#> 13 A          Q3       2.93
#> 14 A          Q4       3.13
#> 15 A          Q5       0.425
#> 16 B          Q1       2.09
#> 17 B          Q2       1.49
#> 18 B          Q3       1.05
#> 19 B          Q4       4.81
#> 20 B          Q5       4.07
Stats <- favstats(value ~ PersonType + Question, data = DFtall)
#> Error in favstats(value ~ PersonType + Question): could not find function "favstats"