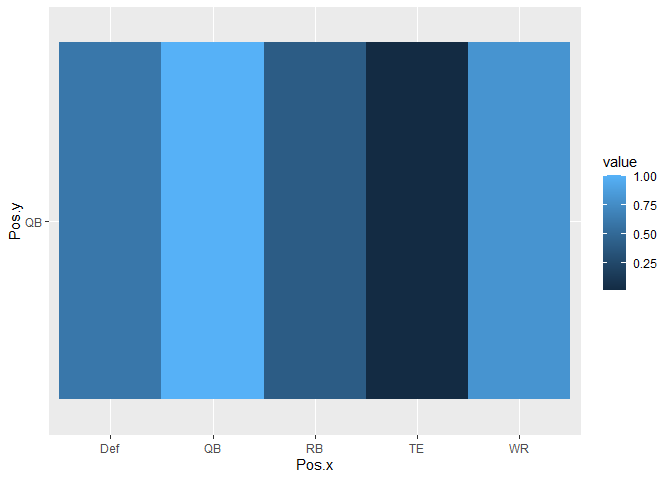
I am trying to build a correlation matrix heat map using geom_tile, but I want to reorder the X and Y axes based on the factors in another column. Below is a sample of the data that I'm using right now (there will be QB, RB, WR, etc. values in the Pos.y column, these are just the first 10 rows):
                 X1             X2         value Pos.x Pos.y
1    Baker Mayfield Baker Mayfield  1.0000000000    QB    QB
2       Kareem Hunt Baker Mayfield  0.0229086957    RB    QB
3        Nick Chubb Baker Mayfield  0.3685311077    RB    QB
4   DErnest Johnson Baker Mayfield  0.0001331921    RB    QB
5     Andy Janovich Baker Mayfield -0.0392098985    RB    QB
6     Jarvis Landry Baker Mayfield  0.4692240161    WR    QB
7     Odell Beckham Baker Mayfield  0.1755536358    WR    QB
8    KhaDarel Hodge Baker Mayfield  0.0086210505    WR    QB
9   Rashard Higgins Baker Mayfield  0.4290631835    WR    QB
10      JoJo Natson Baker Mayfield  0.1645174257    WR    QB
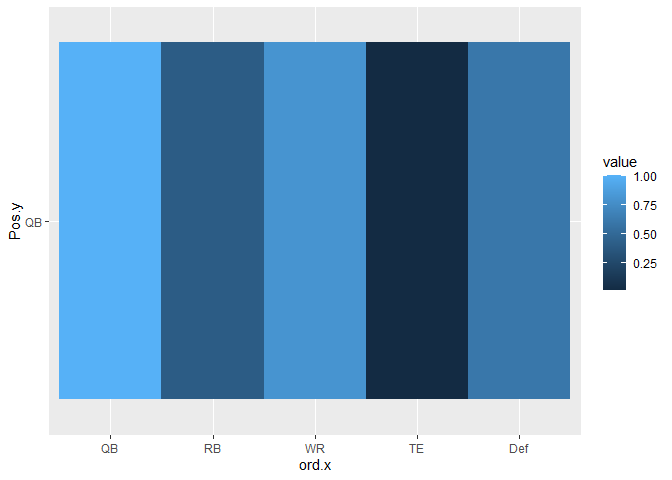
What I want to do is reorder the X-axis by Pos.x and the Y-axis by Pos.y , using the following factor levels:
data$Pos.x <- factor(data$Pos.x, levels = c("QB", "RB", "WR", "TE", "Def"))
Below is the code I currently have for my plot:
ggplot(data = data)+
  geom_tile(aes(x = X1, y = X2, fill = value))
I've tried using arrange() on the dataset and reorder() in the aesthetics but nothing seems to be working. Any suggestions?