Hi, I have a data frame but the variables are plotted in alphabetical order on x axis as below:
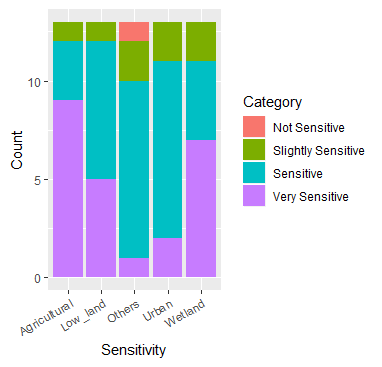
, but I would like them to appear as in a data frame. This is my reprex. Thanks
library(dplyr)
library(tidyr)
library(ggplot2)
library(forcats)
df <- data.frame(
- id = c(1, 2, 3, 4, 5, 6, 7, 8, 9, 10, 11, 12, 13),
- Urban = c(3, 3, 3, 4, 3, 3, 3, 3, 2, 3, 4, 3, 2),
- Low_land = c(4, 3, 4, 3, 4, 3, 3, 4, 2, 4, 3, 3, 3),
- Agricultural = c(4, 3, 4, 4, 4, 3, 4, 4, 2, 4, 4, 4,3),
- Wetland = c(4, 3, 4, 3, 3, 2, 4, 4, 2, 4, 4, 4, 3),
- Others = c(2, 3, 3, 3, 3, 3, 3, 1, 3, 3, 4, 3, 2)
- )
df %>%
-
gather(variable, category, -id) %>% -
filter(!is.na(category)) %>% -
count(variable, category) %>% -
ggplot(aes(x = variable, -
y = n, -
fill = factor(category, labels = c("Not Sensitive", "Slightly Sensitive", "Sensitive", "Very Sensitive")))) + -
geom_col() + -
labs(x = "Sensitivity", -
y = "Count", -
fill = "Category") + -
theme(axis.text.x = element_text(angle=30, hjust=1, vjust = 1))