Reorder the y axis variables

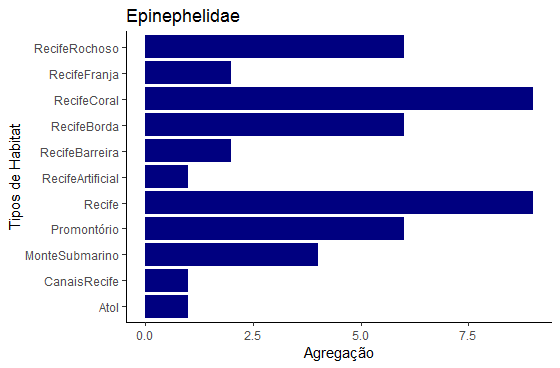
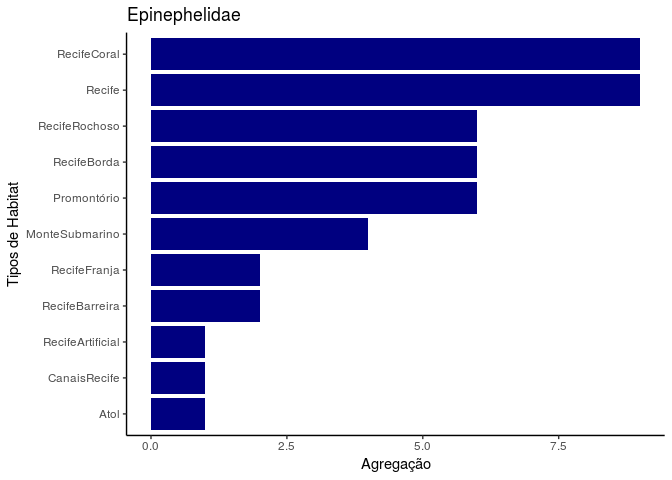
How can I sort my variances from the largest to the smallest bar?

library(tidyverse, quietly = TRUE)
binary_data <- data.frame(stringsAsFactors=FALSE,
                          Species = c(
                            "Mycteroperca bonaci", "Epinephelus ongus", "Paranthias colonus", "Dermatolepis dermatolepis", "Mycteroperca prionura", "Epinephelus striatus", "Epinephelus fuscoguttatus", "Epinephelus guttatus", "Epinephelus itajara", "Epinephelus marginatus", "Epinephelus rivulatus", "Mycteroperca jordani", "Mycteroperca rosacea", "Mycteroperca tigris", "Mycteroperca venenosa", "Mycteroperca xenarcha", "Plectropomus areolatus", "Plectropomus leopardus", "Plectropomus maculatus", "Plectropomus punctatus"), 
                          RecifeCoral = c(1, 0, 0, 0, 0, 1, 1, 1, 1, 0, 0, 0, 0, 1, 1, 0, 1, 1, 0, 0),
                          Recife = c(1, 0, 0, 0, 0, 1, 1, 1, 0, 0, 0, 0, 0, 1, 1, 0, 1, 1, 1, 0),
                          RecifeRochoso = c(0, 0, 0, 0, 1, 0, 0, 0, 1, 1, 0, 1, 1, 0, 0, 1, 0, 0, 0,	0),
                          RecifeBorda = c(1, 0, 0, 0, 0, 1, 1, 1, 0, 0, 1, 0, 0, 0, 0, 0, 0, 0, 0, 1),
                          Promontório = c(1, 0, 0, 0,	0, 1, 1, 0, 0, 0, 0, 0, 0, 1, 1, 0, 1, 0, 0, 0),
                          MonteSubmarino = c(0, 0, 1, 1, 1, 1, 0, 0, 0, 0, 0, 0, 0, 0, 0, 0, 0, 0, 0, 0),
                          RecifeBarreira = c(1, 0, 0, 0, 0,	1, 0, 0, 0, 0, 0, 0, 0, 0, 0, 0, 0, 0, 0, 0),
                          RecifeFranja = c(0, 1, 0, 0, 0, 0, 0, 0, 0, 0, 0, 0, 0, 0, 0, 0, 0, 1, 0, 0), 
                          Atol = c(1, 0, 0, 0, 0, 0, 0, 0, 0, 0, 0, 0, 0, 0, 0, 0, 0, 0, 0, 0), 
                          CanaisRecife = c(0, 1, 0, 0, 0, 0, 0, 0, 0, 0, 0, 0, 0, 0, 0, 0, 0, 0, 0, 0), 
                          RecifeArtificial = c(0, 0, 0, 0, 0, 0, 0, 0, 1, 0, 0, 0, 0, 0, 0, 0, 0, 0, 0, 0)
)
binary_data %>% 
  gather('Habitat', 'Presence', -Species) %>%
  group_by(Habitat) %>% 
  summarise(n = sum(Presence)) %>% 
  ggplot(aes(x = Habitat, y = n)) +
  geom_col(fill = "navyblue") +
  theme_classic() + coord_flip() + labs(title = "Epinephelidae", x = "Tipos de Habitat", y = "Agregação")

image

Use reorder()

library(tidyverse, quietly = TRUE)
binary_data <- data.frame(stringsAsFactors=FALSE,
                          Species = c(
                              "Mycteroperca bonaci", "Epinephelus ongus", "Paranthias colonus", "Dermatolepis dermatolepis", "Mycteroperca prionura", "Epinephelus striatus", "Epinephelus fuscoguttatus", "Epinephelus guttatus", "Epinephelus itajara", "Epinephelus marginatus", "Epinephelus rivulatus", "Mycteroperca jordani", "Mycteroperca rosacea", "Mycteroperca tigris", "Mycteroperca venenosa", "Mycteroperca xenarcha", "Plectropomus areolatus", "Plectropomus leopardus", "Plectropomus maculatus", "Plectropomus punctatus"), 
                          RecifeCoral = c(1, 0, 0, 0, 0, 1, 1, 1, 1, 0, 0, 0, 0, 1, 1, 0, 1, 1, 0, 0),
                          Recife = c(1, 0, 0, 0, 0, 1, 1, 1, 0, 0, 0, 0, 0, 1, 1, 0, 1, 1, 1, 0),
                          RecifeRochoso = c(0, 0, 0, 0, 1, 0, 0, 0, 1, 1, 0, 1, 1, 0, 0, 1, 0, 0, 0,    0),
                          RecifeBorda = c(1, 0, 0, 0, 0, 1, 1, 1, 0, 0, 1, 0, 0, 0, 0, 0, 0, 0, 0, 1),
                          Promontório = c(1, 0, 0, 0,   0, 1, 1, 0, 0, 0, 0, 0, 0, 1, 1, 0, 1, 0, 0, 0),
                          MonteSubmarino = c(0, 0, 1, 1, 1, 1, 0, 0, 0, 0, 0, 0, 0, 0, 0, 0, 0, 0, 0, 0),
                          RecifeBarreira = c(1, 0, 0, 0, 0, 1, 0, 0, 0, 0, 0, 0, 0, 0, 0, 0, 0, 0, 0, 0),
                          RecifeFranja = c(0, 1, 0, 0, 0, 0, 0, 0, 0, 0, 0, 0, 0, 0, 0, 0, 0, 1, 0, 0), 
                          Atol = c(1, 0, 0, 0, 0, 0, 0, 0, 0, 0, 0, 0, 0, 0, 0, 0, 0, 0, 0, 0), 
                          CanaisRecife = c(0, 1, 0, 0, 0, 0, 0, 0, 0, 0, 0, 0, 0, 0, 0, 0, 0, 0, 0, 0), 
                          RecifeArtificial = c(0, 0, 0, 0, 0, 0, 0, 0, 1, 0, 0, 0, 0, 0, 0, 0, 0, 0, 0, 0)
)

binary_data %>% 
    gather('Habitat', 'Presence', -Species) %>%
    group_by(Habitat) %>% 
    summarise(n = sum(Presence)) %>% 
    ggplot(aes(x = reorder(Habitat, n), y = n)) +
    geom_col(fill = "navyblue") +
    theme_classic() + coord_flip() + labs(title = "Epinephelidae", x = "Tipos de Habitat", y = "Agregação")

2 Likes

This topic was automatically closed 7 days after the last reply. New replies are no longer allowed.

If you have a query related to it or one of the replies, start a new topic and refer back with a link.