Hello,
I'm analyzing my health data in R and I want to have a ggridge plot with the density for each month since 09/2020. My data is like this :
Date ; Activité
15/09/2020 ; 19997
I have done this plot with the following code :
''' r
HISTMARCHE$YearMonth <- format(HISTMARCHE$Date, "%Y-%b")
HISTMARCHE$YearMonth <- factor(HISTMARCHE$YearMonth, levels = unique(HISTMARCHE$YearMonth)[order(-ymd(paste0(HISTMARCHE$YearMonth, "-01")))])
ggplot(HISTMARCHE, aes(x = Marche, y = YearMonth)) +
geom_density_ridges_gradient(aes(fill=..x..),scale = 3, alpha = 0.6, point_color = "white") +
scale_fill_gradientn(
colours = c("#A9FBAC","green3","green4","slateblue1","steelblue","navyblue","#0E0A37"),
limits=c(5000,48000), name="Pas",
oob = scales::squish, guide = guide_colorbar(barwidth = 10, barheight = 1))+
labs(
title = 'Activité sportive',x="Activité sportive",y="Mois",
subtitle = 'Densités de répartition 2020-2023'
)+
theme_ridges(font_size = 13, grid=TRUE)+
theme(legend.position = "bottom")
ggsave("plot.jpg", height=7, width=5, bg="white",dpi=1000)
'''
And the result :
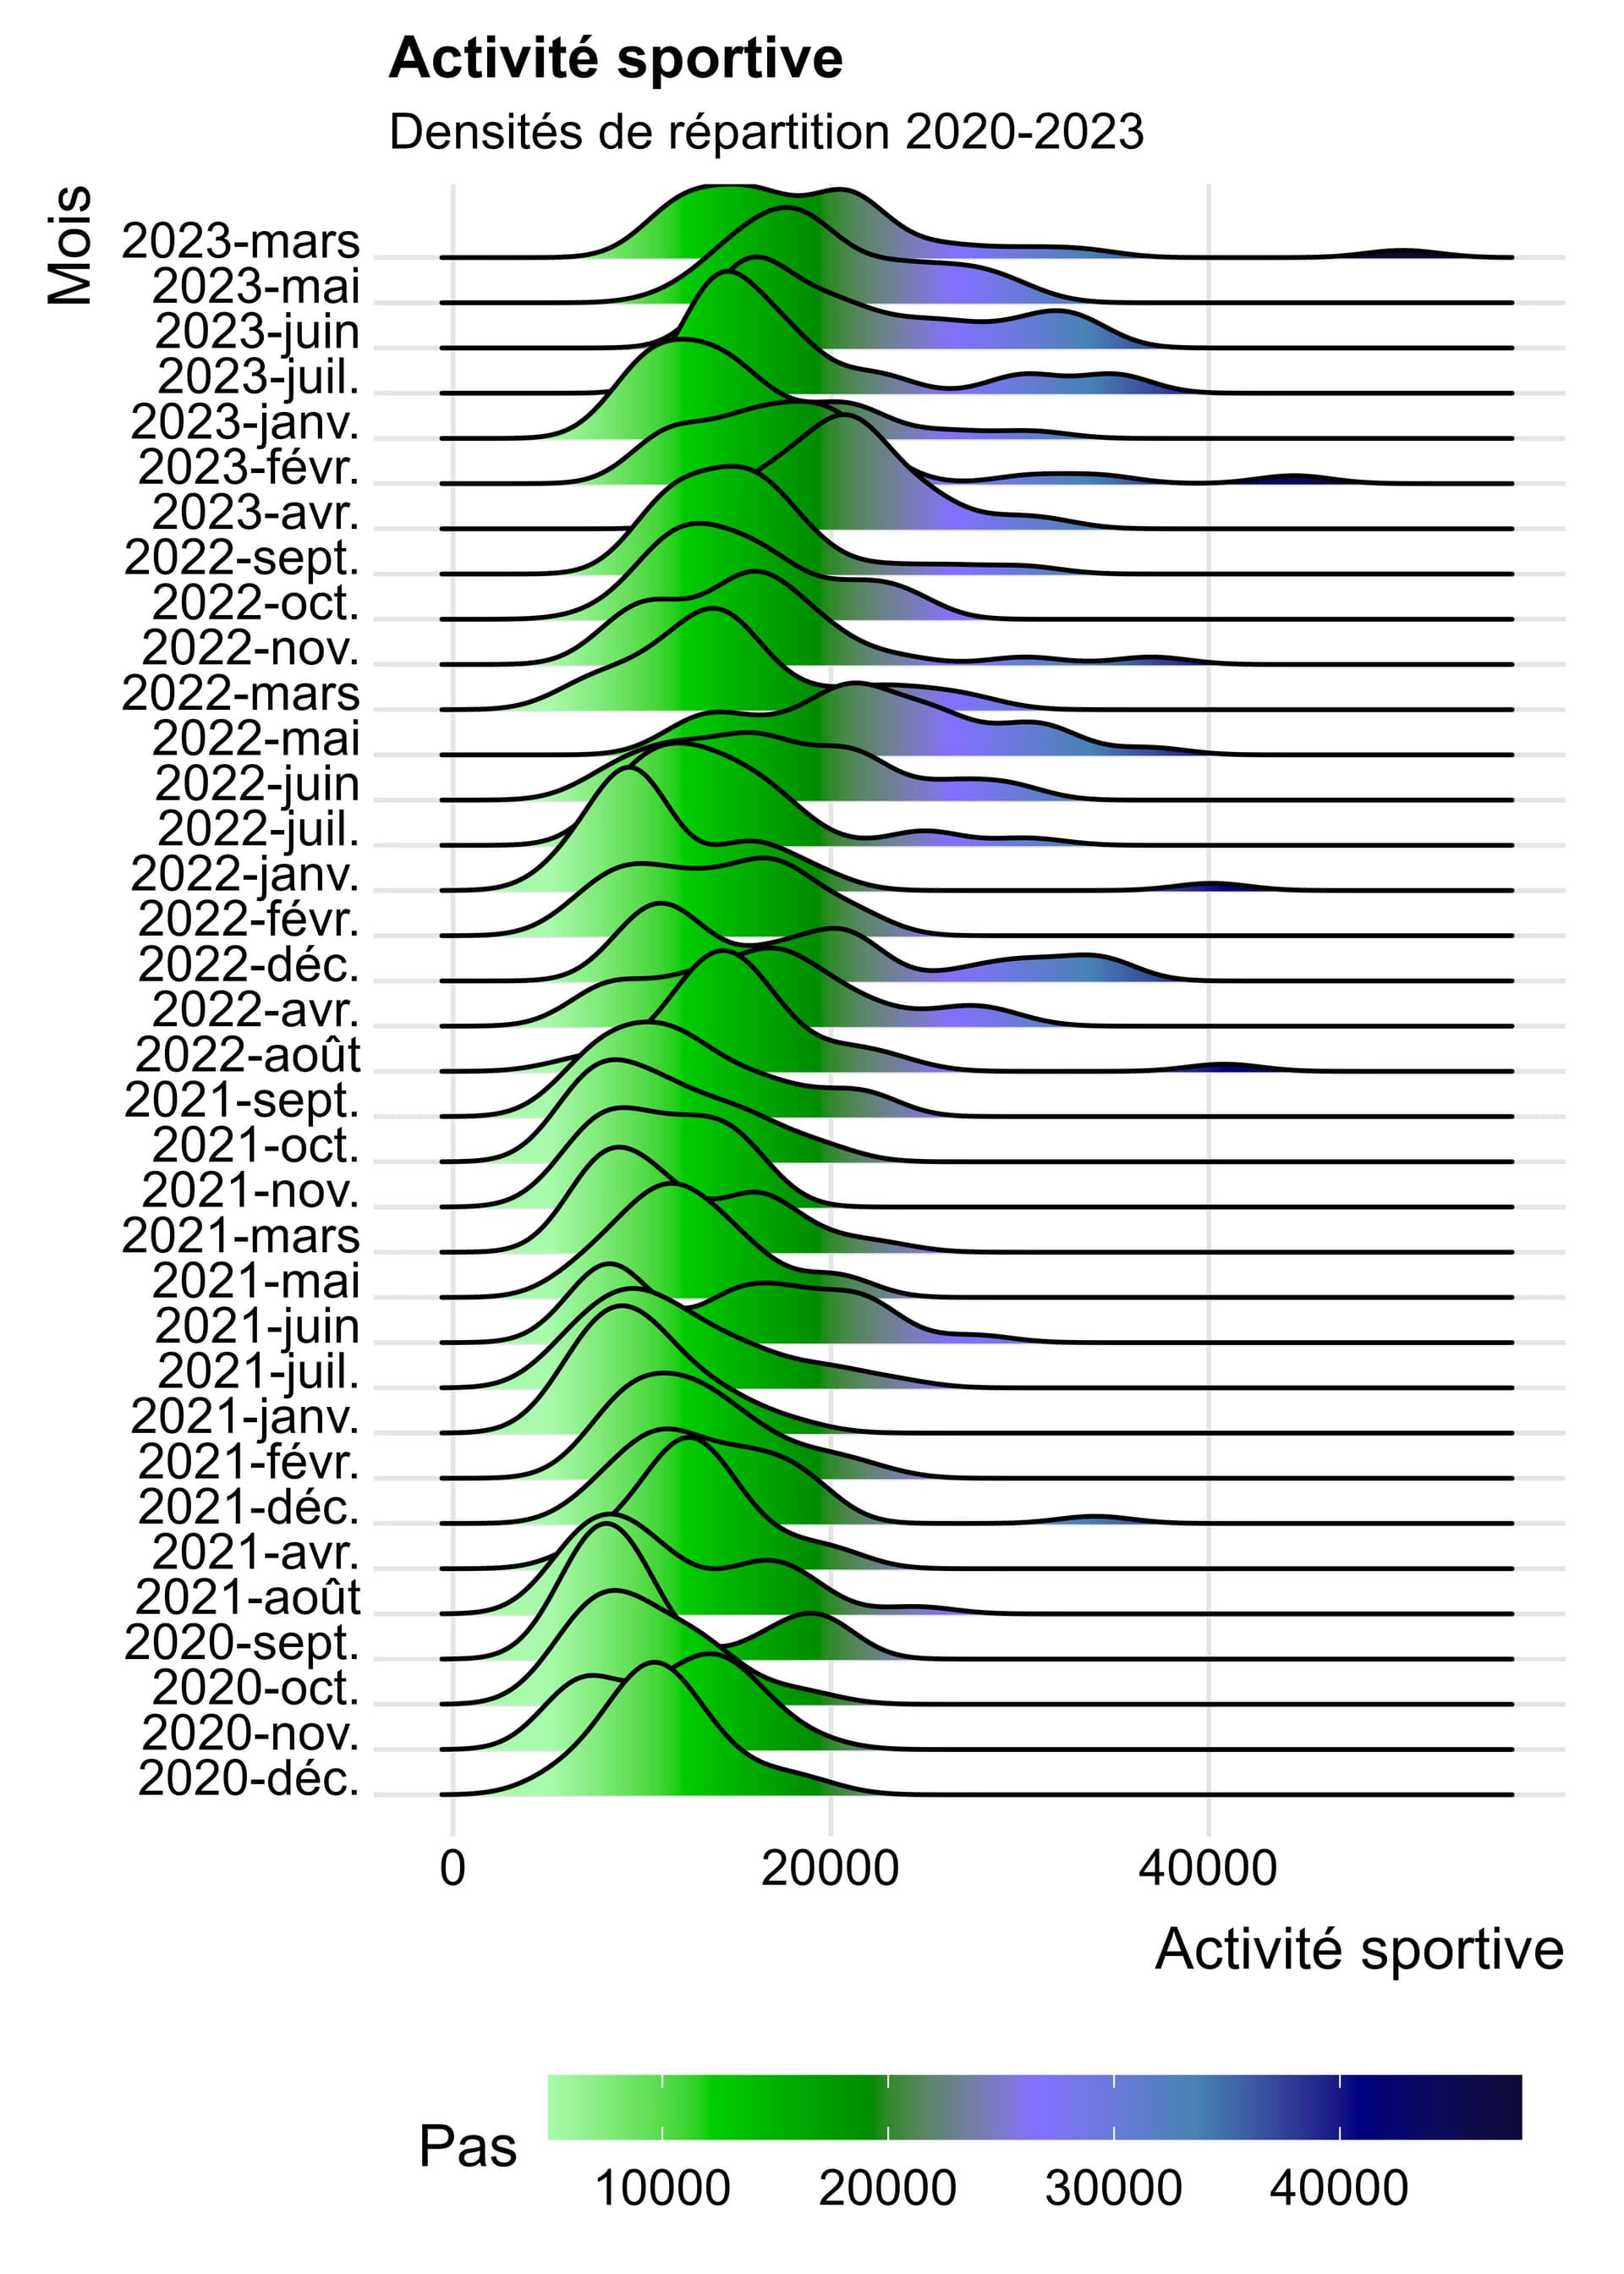
**However, the order of months is not good because it's not chronogical : i want to have the newest in first, the oldest at the bottom y ordered months **
Thanks you for your help !