I think you want to use {forcats}, like this:
library(tidyverse)
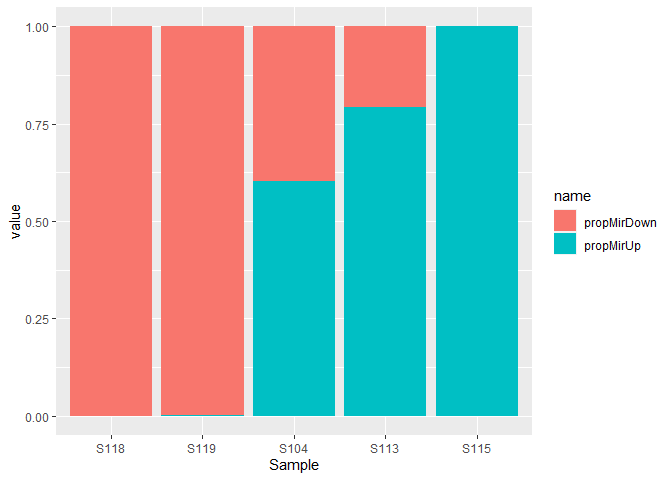
table_plots <- read_csv(
"Sample, propMirUp, propMirDown
S104, 0.6024, 0.39763
S113, 0.7922, 0.20775
S115, 1.0000, 0.00000
S118, 0.0000, 1.00000
S119, 0.0006, 0.99940"
)
#> Rows: 5 Columns: 3
#> -- Column specification --------------------------------------------------------
#> Delimiter: ","
#> chr (1): Sample
#> dbl (2): propMirUp, propMirDown
#>
#> i Use `spec()` to retrieve the full column specification for this data.
#> i Specify the column types or set `show_col_types = FALSE` to quiet this message.
table_plots_long <- table_plots %>%
mutate(Sample = fct_reorder(Sample, propMirUp)) %>%
pivot_longer(!Sample)
ggplot(table_plots_long, aes(x = Sample, y = value, fill = name)) +
geom_bar(position = "stack", stat = "identity")
Created on 2022-03-22 by the reprex package (v2.0.1)