Reorder categories in geom_bar()

Hello,

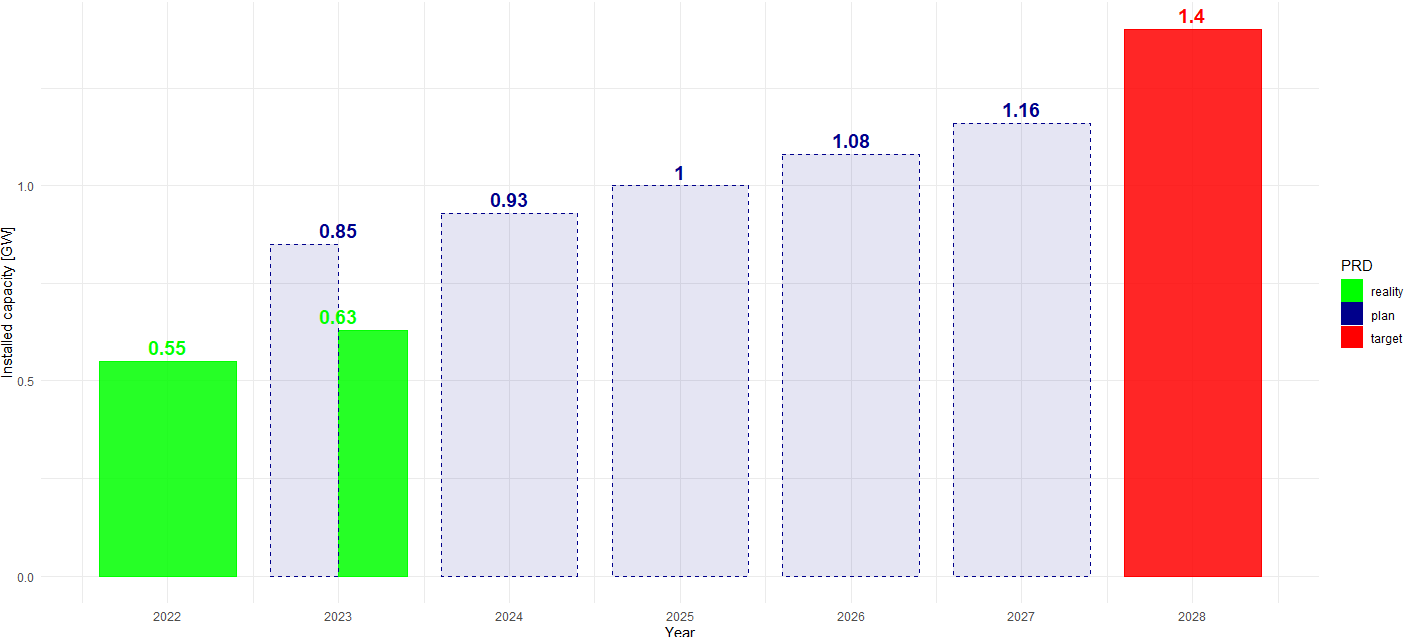
I have a bar chart where x axis are years and y axis is a numeric variable. There are three main categories: "reality", "plan" and "target". In year 2023 I have a variable value for both categories: "reality" and "plan" in a single year - please see the attached chart.
I am trying to accomplish:

  • reorder the categories if they are present in a single year in a way that "reality" column is first, before "plan"
  • adjust the position of text label for such columns (year 2023)

Just noting, that my ggplot chart is taking additional properties (like color, alphy, linetype) from the dataframe; thats why I am using "scale_x_identity()"

Thank you in advance for any help.

My code:

df <- tibble::tribble(
    ~year, ~value, ~record_type, ~alpha, ~linetype, ~fill_color,
    2022, 0.55, "reality", 0.85, "solid", "green",
    2023, 0.63, "reality", 0.85, "solid", "green",
    2023, 0.85, "plan", 0.10, "dashed", "darkblue",
    2024, 0.93, "plan", 0.10, "dashed", "darkblue",
    2025, 1, "plan", 0.10, "dashed", "darkblue",
    2026, 1.08, "plan", 0.10, "dashed", "darkblue",
    2027, 1.16, "plan", 0.10, "dashed", "darkblue",
    2028, 1.4, "target", 0.85, "solid", "red"
  )


  df
#> # A tibble: 8 × 6
#>    year value record_type alpha linetype fill_color
#>   <dbl> <dbl> <chr>       <dbl> <chr>    <chr>     
#> 1  2022  0.55 reality      0.85 solid    green     
#> 2  2023  0.63 reality      0.85 solid    green     
#> 3  2023  0.85 plan         0.1  dashed   darkblue  
#> 4  2024  0.93 plan         0.1  dashed   darkblue  
#> 5  2025  1    plan         0.1  dashed   darkblue  
#> 6  2026  1.08 plan         0.1  dashed   darkblue  
#> 7  2027  1.16 plan         0.1  dashed   darkblue  
#> 8  2028  1.4  target       0.85 solid    red
  
  
  ggplot2::ggplot(
    data = df,
    aes(x = year, y = value)
  ) +
    geom_bar(
      aes(
        alpha = alpha,
        linetype = linetype,
        color = fill_color,
        fill = fill_color
      ),
      stat = "identity",
      position = "dodge",
      linewidth = .25,
      width = .8
    ) +
    
    geom_text(
      aes(
        x = year,
        y = value,
        label = value,
        vjust = -0.45,
        color = fill_color
      ),
      size = 5,
      fontface = "bold"
    ) +
    
    scale_fill_identity(
      "PRD",
      labels = df$record_type,
      breaks = df$fill_color,
      guide = "legend"
    ) +
    
    scale_color_identity() +
    
    scale_linetype_identity() +
    
    scale_alpha_identity() +
    
    scale_x_continuous(
      name = "Year",
      breaks = unique(renew_targets_sk$year)  
    ) +
    
    scale_y_continuous(
      name = "Installed capacity [GW]"
    ) +
    
    theme_minimal()
#> Error in aes(x = year, y = value): could not find function "aes"

Created on 2024-05-30 with reprex v2.1.0

Hi @rcepka

the reprex didn't work so i had to change a few things.

df <- tibble::tribble(
  ~year, ~value, ~record_type, ~alpha, ~linetype, ~fill_color,
  2022, 0.55, "reality", 0.85, "solid", "green",
  2023, 0.63, "reality", 0.85, "solid", "green",
  2023, 0.85, "plan", 0.10, "dashed", "darkblue",
  2024, 0.93, "plan", 0.10, "dashed", "darkblue",
  2025, 1, "plan", 0.10, "dashed", "darkblue",
  2026, 1.08, "plan", 0.10, "dashed", "darkblue",
  2027, 1.16, "plan", 0.10, "dashed", "darkblue",
  2028, 1.4, "target", 0.85, "solid", "red"
)
#added
df$record_type <- factor(df$record_type, levels = c("reality", "plan", "target"))

library(ggplot2)

ggplot(
  data = df,
  aes(x = year, y = value)
) +
  geom_bar(
    aes(
      alpha = alpha,
      linetype = linetype,
      color = fill_color,
      fill = fill_color,
#added
      group = record_type
    ),
    stat = "identity",
    position = "dodge",
    linewidth = .25,
    width = .8
  ) +
  
  geom_text(
    aes(
      x = year,
      y = value,
      label = value,
      vjust = -0.45,
      color = fill_color,
#added
      group = record_type
    ),
#added
    position = position_dodge(width = 0.9),
    size = 5,
    fontface = "bold"
  ) +
  
  scale_fill_identity(
    "PRD",
    labels = df$record_type,
    breaks = df$fill_color,
    guide = "legend"
  ) +
  
  scale_color_identity() +
  
  scale_linetype_identity() +
  
  scale_alpha_identity() +
  
  scale_x_continuous(
    name = "Year",
#added df instead of renew_targets_sk
    breaks = unique(df$year)  
  ) +
  
  scale_y_continuous(
    name = "Installed capacity [GW]"
  ) +
  
  theme_minimal()

Is this the desired result?

Explanation:

When you make a factor variable instead of a chr ggplot2 will use the levels for ordering.
I commented the code with #added where i added things to make it work.

1 Like

Hi @vedoa,

thank you for your response. Yes, this is the desired output.

So to recap your changes:

  • made "record_type" a factor and reordered the levels, so we got the desired order of categories
  • grouped by "record_type" in both geom_bar and geom_text - I do not understand much why was this needed, because it seemed grouped already before...
  • added position_dodge with width parameter in geom_text - probably this ensures that we get the text labels centered just above the columns,

Thank you for your effort, your response was very helpful.
All the best!

1 Like

This topic was automatically closed 7 days after the last reply. New replies are no longer allowed.

If you have a query related to it or one of the replies, start a new topic and refer back with a link.