Rename several columns at once by shared string

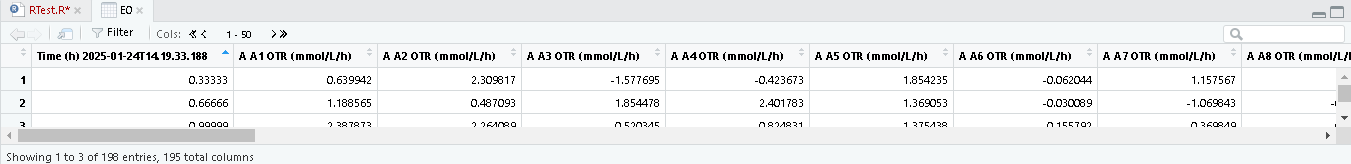
So I'm wondering.. I have a table of several colums that have names consisting of A to H and consecutive numbers and a looong annex xxx, e.g. "A1 xxx", "A2 xxx", ..., "H11 xxx", "H12 xxx" and the first one containing the time. Since I want to adress the columns calculating mean and standard deviation from them, it would be really helpful to rename them to something shorter, so only the "A1" is still standing, whithout the appndix.

I was thinking of using a loop to do it, but I feel there might be a smarter solution using tidyverse/dplyr. Is there a possibility of using the same loop for mean and standard deviation? It would be like "A1" to "A3" and "A4" to "A6", ... to "H10" to "H12" belong together and give data for one mean and standard deviation each.

I was trying to start with

head(data) %>% rename_with(~ substring())

But I'm not sure how to proceed and if "substring" is really what I am looking for.
I'm happy for any suggestions.

Hi @Ishavn13, thank you for your question.

I think you're on the right lines with dplyr::rename_with()- I've used it with stringr::str_extract to get the part of the column name you're interested in, e.g. 'A1'.

data <- tibble::tribble(
  ~`Time (h) 2025-01-24T 14.19.33.188`, ~`A A1 OTR (mmol/L/h)`, ~`A A2 OTR (mmol/L/h)`, ~`A A3 OTR (mmol/L/h)`,
  0.33333, 0.639942, 2.309817, -1.577695, 
  0.66666, 1.188565, 0.487093, 1.854478
)

data_renamed <- 
  data |> 
  dplyr::rename_with(
    .cols = 2:length(names(data)), # select all columns except the first one
    .fn = ~stringr::str_extract(
      string = .x,
      pattern = '\\h([[:alnum:]]+)\\h' # pick out the alphanumeric portion between two spaces, e.g. ' A1 '
    ) |> trimws() # remove the spaces
  )

# see the result
data_renamed
#> # A tibble: 2 × 4
#>   `Time (h) 2025-01-24T 14.19.33.188`    A1    A2    A3
#>                                 <dbl> <dbl> <dbl> <dbl>
#> 1                               0.333 0.640 2.31  -1.58
#> 2                               0.667 1.19  0.487  1.85

Created on 2025-01-31 with reprex v2.1.1

I'm not the best with regex, so had to do some cleanup afterwards using trimws(). Maybe you could find a neater way of doing this?

1 Like
data<-tibble(
  dates=NA,
  `a1 sds`=sample(1:100, 1000, TRUE),
  `a2 ewew ds`=sample(1:100, 1000, TRUE),
  `a3 sds ewe`=sample(1:100, 1000, TRUE),
  `a4 78 wew sds`=sample(1:100, 1000, TRUE),
  
  
)


data %>% 
  rename_with(~ str_sub(., 1, 2), .cols = starts_with("a")) %>% 
  glimpse()

I fancy using pivot_longer() to get these data into a (potentially) more useable format:

suppressPackageStartupMessages(library(tidyverse))

dat <- tibble::tribble(
  ~`Time (h) 2025-01-24T 14.19.33.188`, ~`A A1 OTR (mmol/L/h)`, 
  ~`A A2 OTR (mmol/L/h)`, ~`A A3 OTR (mmol/L/h)`,
  0.33333, 0.639942, 2.309817, -1.577695, 
  0.66666, 1.188565, 0.487093, 1.854478
)

dat %>% 
  pivot_longer(cols=starts_with("A"),
               names_to="old_group",
               values_to="value") %>% 
  arrange(old_group) %>% 
  rename(time = starts_with("Time")) %>%
  extract(col=old_group, into="new_group", regex='\\h([[:alnum:]]+)\\h') %>% 
  group_by(new_group) %>% 
  summarize(mean_val = mean(value, na.rm=TRUE),
            sd_val = sd(value, na.rm=TRUE))
#> # A tibble: 3 × 3
#>   new_group mean_val sd_val
#>   <chr>        <dbl>  <dbl>
#> 1 A1           0.914  0.388
#> 2 A2           1.40   1.29 
#> 3 A3           0.138  2.43

Created on 2025-02-02 with reprex v2.1.1

1 Like

Thank you all for handing in so nice solutions. I tried to find the best for my purposes and decided on the following, with "E1" being my "data":

E1_renamed <-
  E1[1:97] %>% rename_with(E1,.fn=~str_extract(string=.x, pattern='\\h([[:alnum:]]+)\\hOTR'), .col=2:97

I selected specific columns and added some information I want to keep next to the "A1" "A2" etc.
However, if I try to plot via ggplot the resulting data it does not work with the trimws() as follows:

E1_renamed <-
  E1[1:97] %>% rename_with(E1,.fn=~str_extract(string=.x, pattern='\\h([[:alnum:]]+)\\hOTR'), .col=2:97
                           %>% trimws()
ggplot(data = E1_renamed) +
  geom_line(mapping = aes(`Time (h) 2025-02-21T17.06.27.915`, E1_renamed$), color = "black", group = 1, linewidth = 1)

Note that the ggplot call is wrong, since I cannot select something for E1_renamed$
This will result in an error

Error in `fortify()`:
! `data` must be a <data.frame>, or an object coercible by `fortify()`, or a valid <data.frame>-like object
  coercible by `as.data.frame()`.
Caused by error in `.prevalidate_data_frame_like_object()`:
! `dim(data)` must return an <integer> of length 2.
Run `rlang::last_trace()` to see where the error occurred.

It seems like trimws() is doing something to the dataframe so it cannot be compiled by the ggplot function.
It works also with the whitespace, but I would prefer the data to be neat, so I would like to remove the whitespace infront. Any suggestions what I can do?

in stead of using twimws, you could use a pattern like

'(?<=\\s)([[:alnum:]]+)(?=\\s) OTR'
in stead of
'\\h([[:alnum:]]+)\\hOTR'

1 Like

Hi @Ishavn13

Are you looking to plot a time-series for A1, A2, etc?

If you are then I'd use @mduvekot's great regex solution to rename without trimws().

Then, similar to @DavoWW's recommendation topivot_longer so that A1, A2, etc appear in a single variable - this data shape works well with {ggplot2}.

data <- tibble::tribble(
  ~`Time (h) 2025-01-24T 14.19.33.188`, ~`A A1 OTR (mmol/L/h)`, ~`A A2 OTR (mmol/L/h)`, ~`A A3 OTR (mmol/L/h)`,
  0.33333, 0.639942, 2.309817, -1.577695, 
  0.66666, 1.188565, 0.487093, 1.854478,
  0.99999, 2.387873, 2.264089, 0.520345,
)

# rename columns other than the 'time'
data_renamed <- 
  data |> 
  dplyr::rename_with(
    .cols = 2:length(names(data)), # select all columns except the first one
    .fn = ~stringr::str_extract(
      string = .x,
      pattern = '(?<=\\s)([[:alnum:]]+)(?=\\s)'
    )
  )

# pivot longer to have time, series and value columns
data_renamed_longer <-
  data_renamed |> 
  tidyr::pivot_longer(
    cols = 2:length(names(data_renamed)),
    names_to = 'series',
    values_to = 'value'
  )

# see the data
data_renamed_longer
#> # A tibble: 9 × 3
#>   `Time (h) 2025-01-24T 14.19.33.188` series  value
#>                                 <dbl> <chr>   <dbl>
#> 1                               0.333 A1      0.640
#> 2                               0.333 A2      2.31 
#> 3                               0.333 A3     -1.58 
#> 4                               0.667 A1      1.19 
#> 5                               0.667 A2      0.487
#> 6                               0.667 A3      1.85 
#> 7                               1.00  A1      2.39 
#> 8                               1.00  A2      2.26 
#> 9                               1.00  A3      0.520

Created on 2025-02-28 with reprex v2.1.1

Then you can feed this data frame to {ggplot2} and use 'geom_line()'

# plot as timeseries
data_renamed_longer |> 
  ggplot2::ggplot(
    ggplot2::aes(
      x = `Time (h) 2025-01-24T 14.19.33.188`,
      y = value,
      group = series,
      colour= series
    )
  ) +
  ggplot2::geom_line()