Hello, can someone please help me.
I am trying to remove stopwords from open_30_day
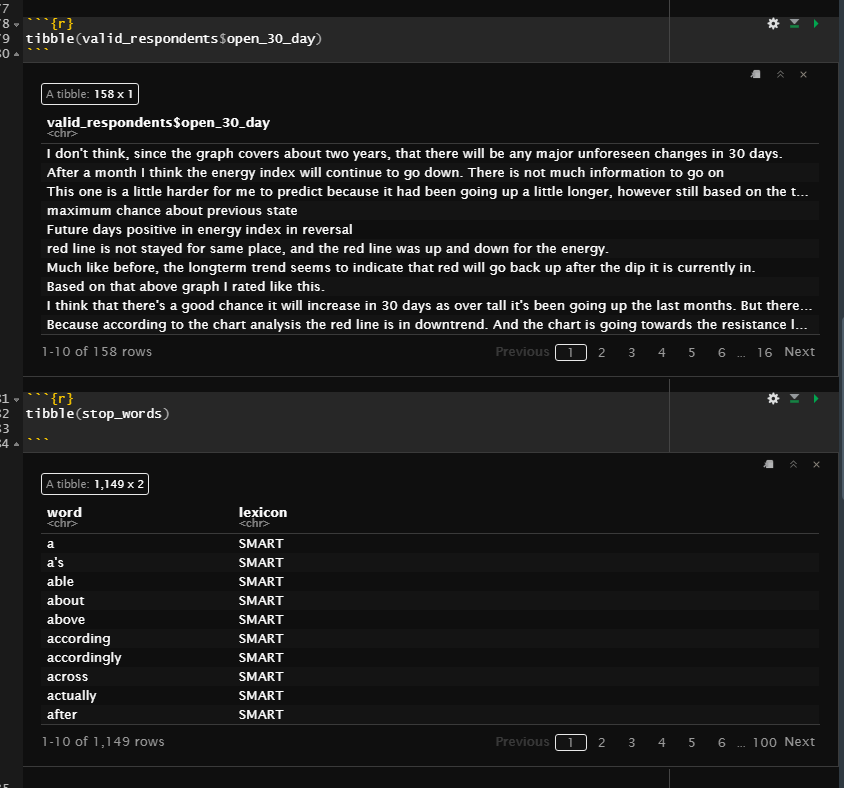
stop_words<- tidytext::stop_words

valid_respondents$open_30_day <- valid_respondents$open_30_day %>%
  filter(!word %in% stop_words$word)
Hello, can someone please help me.
I am trying to remove stopwords from open_30_day
stop_words<- tidytext::stop_words
valid_respondents$open_30_day <- valid_respondents$open_30_day %>%
filter(!word %in% stop_words$word)
Assuming that your dataframe looks something like:
# A tibble: 5 x 1
  word
  <chr>
1 i
2 am
3 an
4 rstudio
5 user
The below code will remove the stopwords:
tibble(word = c("i", "am", "an", "rstudio", "user")) |>
  dplyr::anti_join(tidytext::get_stopwords())
# A tibble: 2 x 1
  word
  <chr>
1 rstudio
2 user
The function anti_join(x,y) returns all of the rows of the dataframe x except those which also feature in a shared column with the data frame y.
In that case, something like:
library(tidyverse)
library(tidytext)

df = tibble(sentences = c("this is a really long sentence", "R is good for text analysis"))

df |>
  unnest_tokens(word, sentences) |>
  anti_join(get_stopwords())
# A tibble: 7 x 1
  word
  <chr>
1 really
2 long
3 sentence
4 r
5 good
6 text
7 analysis
Note that it is often useful to provide a reproducible example when asking for help, otherwise we can only guess at what your data looks like.
FAQ: What's a reproducible example (reprex) and how do I create one?
I don't get this part (I'm a giga noob)
df = tibble(sentences = c("this is a really long sentence", "R is good for text analysis"))
you want me to copy-paste all the sentences?
Right, so that bit is just me setting up a data frame that I can use with tidytext. When learners only provide a screen-shot (which we can't copy-paste!) we have to come up with an approximation of their data locally on our computers.
By the looks of your screen shot, you have a data frame called "valid_respondents" where one of the columns is "open_30_day". "open_30_day" contains a load of very long strings that you want to remove the stopwords from.
I can try to imitate it:
valid_respondents = tibble(
  open_30_day = c(
    "I don't think, since the graph covers",
    "After a month I think the energy index will"
  )
)
# A tibble: 2 x 1
  open_30_day
  <chr>
1 I don't think, since the graph covers
2 After a month I think the energy index will
From here, I use tidytext to "unnest" the sentences into individual words:
valid_respondents |>
  unnest_tokens(word, open_30_day)
# A tibble: 16 x 1
   word
   <chr>
 1 i
 2 don't
 3 think
 4 since
 5 the
 6 graph
 7 covers
 8 after
 9 a
10 month
11 i
12 think
13 the
14 energy
15 index
16 will
And then I can remove the stop words by using anti_join() from dplyr.
valid_respondents |>
  unnest_tokens(word, open_30_day) |>
  anti_join(get_stopwords())
# A tibble: 8 x 1
  word
  <chr>
1 think
2 since
3 graph
4 covers
5 month
6 think
7 energy
8 index
So how do I "setting up a data frame that I can use with tidytext", from what I see with my noob eyes is still that I have to go into the column and copy-paste every sentence into the vector c(). Sorry if I misunderstand
You have an object in R called "valid_respondents" - what is that? Is it a dataframe/tibble? If so, it's already ready to go!
It'd be useful to have access to your data; to provide enough for a "reproducible example" you could write dput(head(valid_respondents)) into your console and copy-paste the result here.
Ah the dput() output hasn't worked... but if you run:
valid_respondents %>%
  unnest_tokens(word, open_30_day) %>%
  anti_join(get_stopwords())
You should get the result you're looking for.
it is not a tibble
is_tibble(valid_respondents)
[1] FALSE
dput(head(valid_respondents))
structure(list(date = c("2021-10-22T15:25:11Z", "2021-10-22T15:34:54Z",
"2021-10-22T15:39:14Z", "2021-10-22T15:41:16Z", "2021-10-22T15:52:30Z",
"2021-10-22T15:52:40Z"), predict_5_increase = c(10L, 50L, 20L,
10L, 20L, 40L), predict_5_same = c(20L, 20L, 10L, 20L, 20L, 30L
), predict_5_decrease = c(70L, 30L, 70L, 70L, 60L, 30L), open_5_day = c("It seems to overall trend downward, and I really doubt it'll go up.",
"It may look like there is a downturn but the overall trend is upwards. It may also go sideways because five days is not a very long.",
"Based off the history of the energy sector has been doing down for awhile. Since it was on a downward track (not that long) after a short upward track I figured it would more than likely keep going down for a little while before going back up.",
"Only one that previous state", "5 days for Red line is reversal for decrease",
"red line is not stayed for same place, and the red line was up and down for the energy."
), predict_30_increase = c(10L, 30L, 40L, 10L, 80L, 40L), predict_30_same = c(20L,
20L, 10L, 20L, 0L, 20L), predict_30_decrease = c(70L, 50L, 50L,
70L, 20L, 40L), open_30_day = c("I don't think, since the graph covers about two years, that there will be any major unforeseen changes in 30 days.",
"After a month I think the energy index will continue to go down. There is not much information to go on",
"This one is a little harder for me to predict because it had been going up a little longer, however still based on the time before the upwards trend that it had been going down, I think it's a little more likely to decrease in this timeframe.",
"maximum chance about previous state", "Future days positive in energy index in reversal",
"red line is not stayed for same place, and the red line was up and down for the energy."
), education = c("12th grade", "Associates degree academic, between 1 and 2 years of college",
"Associates degree vocational, 3 or more years of college", "Bachelor's degree",
"Master's degree", "Master's degree"), television = c("Never",
"Daily", "1-3 times a year", "Daily", "Daily", "1 day a week"
), radio = c("Never", "Never", "1-3 times a month", "4 days a week",
"5 days a week", "1-3 times a month"), print = c("Never", "2 days a week",
"1-3 times a month", "6 days a week", "Daily", "1-3 times a month"
), comp_smart_tab = c("Daily", "Daily", "Daily", "Daily", "Daily",
"1 day a week"), dig_web_app = c("Daily", "Daily", "Daily", "Daily",
"Daily", "1 day a week"), dig_SOME = c("Never", "Daily", "Daily",
"Daily", "Daily", "1-3 times a month"), dig_internet = c("Never",
"6 days a week", "6 days a week", "Daily", "Daily", "1-3 times a month"
), dig_podcast = c("Never", "3 days a week", "1-3 times a month",
"6 days a week", "6 days a week", "1 day a week"), age = c(22L,
60L, 36L, 62L, 58L, 25L), gender = c("Man", "Man", "Woman", "Man",
"Man", "Woman"), Total.time = c(108.58, 218.58, 274.24, 293.82,
397.98, 269.92), sum_predict_5 = c(100L, 100L, 100L, 100L, 100L,
100L), sum_predict_30 = c(100L, 100L, 100L, 100L, 100L, 100L)), row.names = c(NA,
6L), class = "data.frame")
Right, so I now have your data in my R.
# A tibble: 6 x 23
  date   predict_5_incre~ predict_5_same predict_5_decre~ open_5_day predict_30_incr~ predict_30_same predict_30_decr~ open_30_day education television
  <chr>             <int>          <int>            <int> <chr>                 <int>           <int>            <int> <chr>       <chr>     <chr>
1 2021-~               10             20               70 It seems ~               10              20               70 I don't th~ 12th gra~ Never
2 2021-~               50             20               30 It may lo~               30              20               50 After a mo~ Associat~ Daily
3 2021-~               20             10               70 Based off~               40              10               50 This one i~ Associat~ 1-3 times~
4 2021-~               10             20               70 Only one ~               10              20               70 maximum ch~ Bachelor~ Daily
5 2021-~               20             20               60 5 days fo~               80               0               20 Future day~ Master's~ Daily
6 2021-~               40             30               30 red line ~               40              20               40 red line i~ Master's~ 1 day a w~
# ... with 12 more variables: radio <chr>, print <chr>, comp_smart_tab <chr>, dig_web_app <chr>, dig_SOME <chr>, dig_internet <chr>,
#   dig_podcast <chr>, age <int>, gender <chr>, Total.time <dbl>, sum_predict_5 <int>, sum_predict_30 <int>
Let me just grab that column you're interested in.
valid_respondents |>
  select(open_30_day)
# A tibble: 6 x 1
  open_30_day
  <chr>
1 I don't think, since the graph covers about two years, that there will be any major unforeseen changes in 30 days.
2 After a month I think the energy index will continue to go down. There is not much information to go on
3 This one is a little harder for me to predict because it had been going up a little longer, however still based on the time before the upwards trend~
4 maximum chance about previous state
5 Future days positive in energy index in reversal
6 red line is not stayed for same place, and the red line was up and down for the energy.
Now I'm going to "unnest" this column:
valid_respondents |>
  select(open_30_day) |>
  unnest_tokens(word, open_30_day)
# A tibble: 121 x 1
   word
   <chr>
 1 i
 2 don't
 3 think
 4 since
 5 the
 6 graph
 7 covers
 8 about
 9 two
10 years
# ... with 111 more rows
And finally get rid of the stop words.
valid_respondents |>
  select(open_30_day) |>
  unnest_tokens(word, open_30_day) |>
  anti_join(get_stopwords())
# A tibble: 56 x 1
   word
   <chr>
 1 think
 2 since
 3 graph
 4 covers
 5 two
 6 years
 7 major
 8 unforeseen
 9 changes
10 30
# ... with 46 more rows
So if you just write the below code chunk in your RStudio, you should get what you want.
valid_respondents |>
  select(open_30_day) |>
  unnest_tokens(word, open_30_day) |>
  anti_join(get_stopwords())
Alright, I get a bunch of words how can I use those words to make a geom_col plot, I will have to do something like this right?
frequent_words <- valid_respondents |>
select(open_30_day) |>
unnest_tokens(word, open_30_day) |>
anti_join(get_stopwords())
and then use frequent_words to make the plot
If this is homework - as per the Homework Policy - we can't just provide a load of copy-paste answers. I only provided the one I have as its basically just copy-pasted from the tidytext documentation.
But with your new data frame you'll be able to answer the second part of the question, producing the graph. To do so, I'd recommend reading up on the dplyr::count() function (write ?count in your console) and reading more about how to plot using ggplot2:
This topic was automatically closed 21 days after the last reply. New replies are no longer allowed.
If you have a query related to it or one of the replies, start a new topic and refer back with a link.