Hi, does anyone know how to remove the pagebreak between heading and first graph of RMarkdown 'asis' output.
In an rmd file.
---
title: test
output:
word_document
---
```{r, mtcars-plots, echo=FALSE, results='asis', fig.width=8, fig.height=9}
for (i in names(mtcars)) {
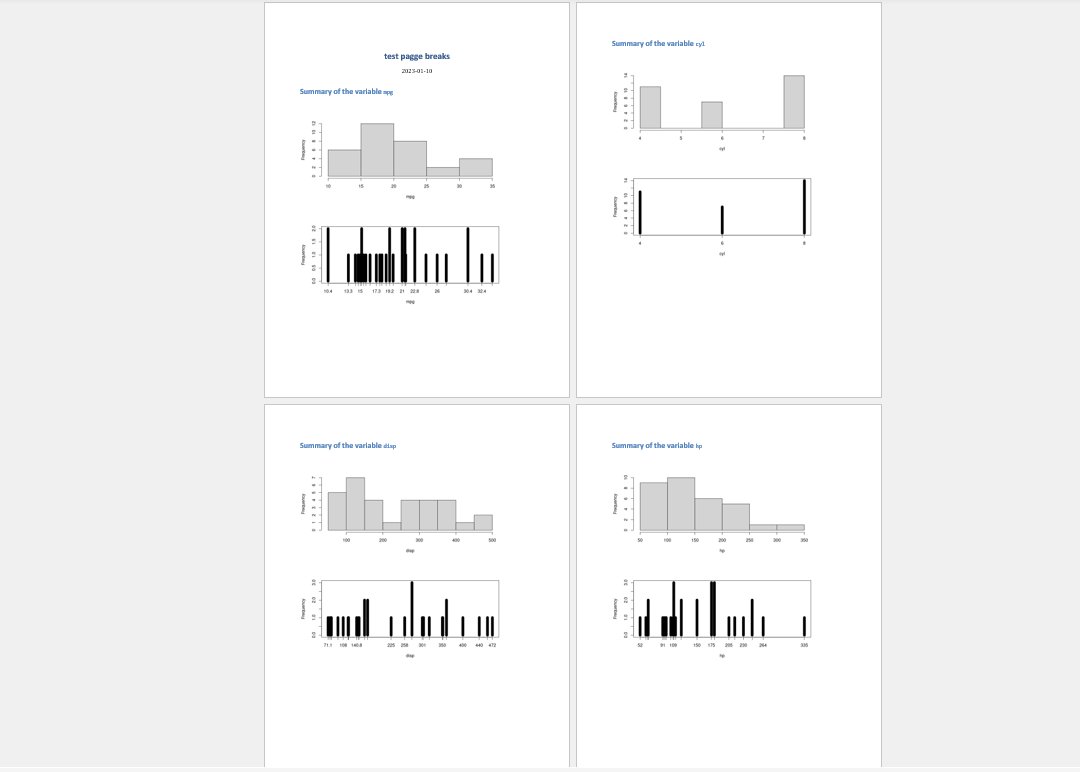
cat('\n\n# Summary of the variable `', i, '`\n\n')
x <- mtcars[, i]
hist(x, xlab = i, main = '')
plot(table(x), xlab = i, ylab = 'Frequency', lwd = 10)
}
Alternatively, my guess is that creating a reference template of word docx and using it in YAML can help as well. you can read more about it here. This reference docx/template can have the margins and other styles of your prefrence.
Thanks for the response @AyushBipinPatel In my real dataset, the graphs need to be that size. I'll look in to the YAML though, but I've also got a standard template to work with.