However, this results in a plot with a total of 6 categories on the x-axis, where each category has 2 boxes (one for positive and one for negative) yielding a total of 12 boxplots. The 6th category is extra displayed as '0' in the axis that I would like to remove. Is this possible?
Also, is there a way to display datapoints in the boxplots for both Positive and Negative boxes?
so if there are 6 types in your data and you wish there only to be 5. You filter them out, with dplyr::filter()
Its not clear to me what you mean by display datapoints, you can certainly add geom_point() to get a scatter overlaid with the boxplots
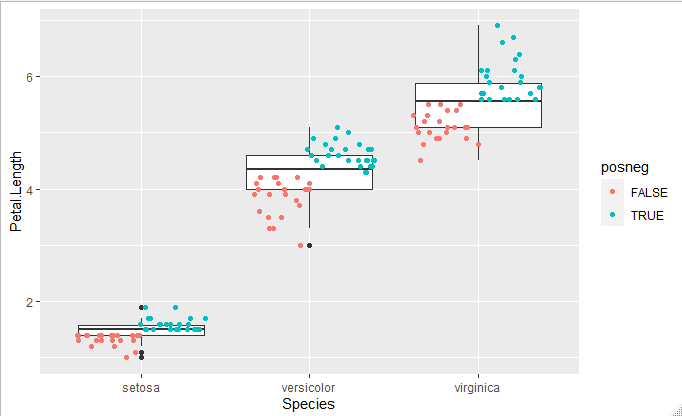
Thanks, I tried the following which worked well for the datapoints
+geom_point(position = position_jitterdodge()
I was wondering if there is a way to change the colour of the dots for datapoints to match the ones used in Positive and Negative boxplots but without fill? By default these were green and red respectively.