llpg
October 27, 2020, 11:24am
1
Hello everybody,
I have a problem when I see my dashboard on R Shiny :
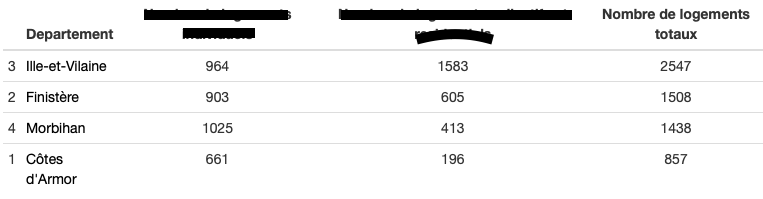
This is my dashboard :
I want to remove the first "column" (3,2,4,1) which is an id ?
Any idea ??
Thank you
what function are you using to render the table ?
llpg
October 27, 2020, 12:48pm
3
df <- df[order(df$Nombre.de.logements.totaux, decreasing=T),]
I thought you were using shiny, so presumably you use a render* function ?
llpg
October 27, 2020, 1:09pm
5
Yes I use a reactive function
this is my reactive function code :
df2_dpt_lgt_aut <- reactive({
      if (input$period == liste_periode[length(liste_periode)]) {
        df <- data.frame("Departement" = c(df2_dpt[which(df2_dpt$periode == input$period),]$departement_commune)
                         ,"Nb ind" = c(df2_dpt[which(df2_dpt$periode == input$period),]$nb_lgt_aut_ind)
                         ,"Nb co" = c(df2_dpt[which(df2_dpt$periode == input$period),]$nb_lgt_aut_coll_res)
                         ,"Nombre de logements totaux" = c((df2_dpt[which(df2_dpt$periode == input$period),]$nb_lgt_aut_ind)+(df2_dpt[which(df2_dpt$periode == input$period),]$nb_lgt_aut_coll_res))
        )}

      else if (input$period != liste_periode[length(liste_periode)]) {
        df <- data.frame("Departement" = c(df2_dpt[which(df2_dpt$periode == input$period),]$departement_commune)
                         ,"Nb ind" = c(df2_dpt[which(df2_dpt$periode == input$period),]$nb_lgt_aut_ind)
                         ,"Nb co" = c(df2_dpt[which(df2_dpt$periode == input$period),]$nb_lgt_aut_coll_res)
                         ,"Nombre de logements totaux" = c((df2_dpt[which(df2_dpt$periode == input$period),]$nb_lgt_aut_ind)+(df2_dpt[which(df2_dpt$periode == input$period),]$nb_lgt_aut_coll_res))

        )}

      df <- df[order(df$Nombre.de.logements.totaux, decreasing=T),] #On ordonne le tableau avec le nb de logements totaux

    })
that wont cause anything to show in screen.
reactive() only makes R reactive objects. It does not render.
llpg
October 27, 2020, 1:17pm
7
It's strange, because if I don't do that :df <- df[order(df$Nombre.de.logements.totaux, decreasing=T),]
Its harder for me to help you when you don't directly address what I say to you.
llpg
October 27, 2020, 1:29pm
9
Thanks for trying to help me, but if there is an easier solution it would be great. Because my code is big, it's juste a small part and I don't want to change all.
llpg
October 27, 2020, 2:18pm
10
May be it's possible to hide this column (put a color white or other) ?
Are you using renderTable? renderDT? Or something else?
llpg
October 27, 2020, 2:34pm
12
I use a renderFormattable
 output$cn <- renderFormattable({
         cn()
    })
and cn is my reactive function when I put my format :
cn <- reactive({
 if (input$territoire == "Département") {
            if (input$donnees_ok == "Logements au") {
                if (input$duree == "Trimestrielle") {
                  formattable(df2_dpt_lgt_aut()
                              , col.names = c("Departement"
                                              ,"Nb ind"
                                              ,"Nb col"
                                              ,"Nombre de logements totaux"
                                              ,"Poid logement EPCI/region"
                                              ,"Evolution T / T-1 *"
                              )
                              , align =c("l","c","c","c","c","c")
                              ,list( "Evolution" = formatter("span"
                                                             , style = x ~ formattable::style(color = ifelse(x == "Données sur T-1 non disponibles", "grey"
                                                                                                             ,ifelse(x>0 & x!="Inf" & x != "NaN", "green"
                                                                                                                     ,ifelse(x<0 & x != "NaN","red","grey"))))

                                                             ,x ~ icontext(ifelse(is.numeric(x), ifelse(x < 0, "arrow-down", "arrow-up"),NA_character_), x))

                                     ,"Departement" = formatter("span"
                                                         , style = ~ formattable::style(color = "black"
                                                                                        ,font.weight = "normal")
                                     )))
                }
#else if     ###all the other condition
})
turns out I was justified in asking you what your render* was...
hiris <- head(iris)

library(shiny)

ui <- fluidPage(
  formattableOutput("ex_rn"),
  formattableOutput("ex")
)

server <- function(input, output, session) {

  rdat <- reactive({
    hiris[order(hiris$Petal.Length,
               decreasing = T
    ),]
  })
  output$ex_rn <- renderFormattable(
    formattable(rdat())
  )
  output$ex <- renderFormattable(
    formattable(rdat(), row.name = FALSE)
  )
}

shinyApp(ui, server)
llpg
October 28, 2020, 11:24am
14
so if I add
formattable(cn(), row.name = FALSE)
in my output$cn , it remove the first column
In this example that doesnt happen.
sign_formatter <- formatter("span",
                            style = x ~ style(color = ifelse(x > 0, "green",
                                                             ifelse(x < 0, "red", "black"))))
sign_formatter(c(-1, 0, 1))


hiris <- head(iris)
hiris$Petal.Length<-hiris$Petal.Length -1.5

library(shiny)

ui <- fluidPage(
  formattableOutput("ex_rn"),
  formattableOutput("ex")
)

server <- function(input, output, session) {

  rdat <- reactive({
    hiris[order(hiris$Petal.Length,
                decreasing = T
    ),]
  })
  output$ex_rn <- renderFormattable(
    formattable(req(rdat()),list(Petal.Length = sign_formatter))
  )
  output$ex <- renderFormattable(
    formattable(req(rdat()),list(Petal.Length = sign_formatter), row.name = FALSE)
  )
}

shinyApp(ui, server)
So how is what you are doing different ?
oh, you are making the mistake of using formattable(cn()) when cn itself contains formattable ()
1 Like
llpg
October 28, 2020, 1:05pm
17
Maaaaaaany thanks, it works
I put row.name = FALSE inside each formattable
system
November 4, 2020, 1:05pm
18
This topic was automatically closed 7 days after the last reply. New replies are no longer allowed.