hi! am new here :0 as well as a neophyte with rscripting.
just wanna know if i can get some help from this forum regarding a project am doing right now coz i am stuck at assumptions check or i am unable to align my y and x variables.
cheers!
erbar
hi! am new here :0 as well as a neophyte with rscripting.
just wanna know if i can get some help from this forum regarding a project am doing right now coz i am stuck at assumptions check or i am unable to align my y and x variables.
cheers!
erbar
Welcome to the forum.
There is a good chance that someone can help though this forum is mainly intended for dealiny with R problems. If you have a strictly stats question CrossValidated mmay be a better place to post.
To help we need a reproducible example (reprex)
tks for the reply.
Background:
We are trying to identify if there is meaningful correlation between fake news and vaccination rate in the US.
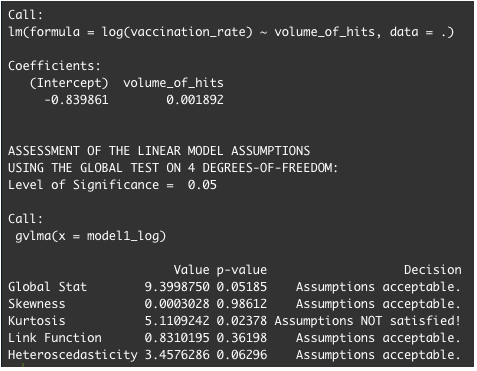
As of this moment, we have a Kurtosis issue when trying to attempt to fit into linear model regression.
Log and Sqrt does not solve the Kurtosis problem.
am trying to upload my rscript here but it is not allowed?
You can copy and paste your script. Enter a line beginning with three back apostrophes, ```.
Then paste your script starting on the next line.
Then add one more line beginning with three back apostrophes,.
What harm do you think kurtosis causes in your regression?
If you have a fair amount of data, you might try including volume_of_hits squared, cubed, etc.
rm(list = ls())

pacman::p_load(tidyverse, lubridate,
               rvest, glue,
               gtrendsR, rtweet,
               broom, modelr,
               Hmisc, DT,
               jtools, huxtable,
               interactions,
               gvlma, ggfortify, car, psych,
               ggthemes, scales, gridExtra
)


glimpse(covid_us_jurisdiction)
glimpse(covid_us_tidy)
glimpse(US_2020)
glimpse(us_vaccination)
glimpse(us_vaccination_news)

view(us_vaccination_news)
view(covid_us_jurisdiction)

view(covid_us_merged)

# Import of CSV files
covid_us_jurisdiction <- read_csv("cdc_vaccines_distributed_administered_by_jurisdiction.csv")
us_2020 <- read_csv("voting.csv")

# Tidy merged dataset
covid_us_tidy <- covid_us_jurisdiction %>%
  select(date, state_abbreviation, state_name, Administered_Dose2_Recip, population) %>%
  rename(state = state_name) %>%
  mutate(vaccination_rate = Administered_Dose2_Recip/population)

# Identify Republican or Democratic State
rep_dem <- us_2020 %>%
  mutate(blue_red_state = ifelse(trump_win, "Republican", "Democratic"))

# Join covid vaccination data set with red/blue state data
us_vaccination <- merge(x = covid_us_tidy, y = rep_dem[ , c("state", "blue_red_state")], by = "state", all.x=TRUE)

# Find out unemployment data for US


# Extracting volume searches of fake news via Gtrends R
covid_search <- gtrends(keyword = c("covid 19 vaccine + dna",
                                    "covid 19 vaccine + death",
                                    "covid 19 vaccine + pregnancy",
                                    "covid 19 vaccine + sick"),
                        geo = "US",
                        gprop = "web",
                        time = "2021-01-04 2021-10-24")


covid_region <- covid_search$interest_by_region

covid_region <- covid_region %>%
  rename(state = location,
         volume_of_hits = `hits`) %>%
  mutate(volume_of_hits = as.numeric(volume_of_hits))

us_vaccination_news <- us_vaccination %>%
  inner_join(covid_region,
             by = "state") %>%
  select(-gprop)

# Dummification of Google trends result
# Set K-1 dummy variables only. This is to avoid multi-collinearity problem
# In our case, Covid vaccine + sick will be our baseline, therefore dummy variable for this keyword will not be created

us_vaccination_news$covid_dna <- ifelse(us_vaccination_news$keyword == 'covid 19 vaccine + dna', 1, 0)
us_vaccination_news$covid_death <- ifelse(us_vaccination_news$keyword == 'covid 19 vaccine + death', 1, 0)
us_vaccination_news$covid_pregnancy <- ifelse(us_vaccination_news$keyword == 'covid 19 vaccine + pregnancy', 1, 0)

# Use Analysis of variance for
model1_log <- us_vaccination_news %>%
  lm(sqrt(vaccination_rate) ~ volume_of_hits,
     .)
gvlma(model1_log)

model1_poissons <- us_vaccination_news %>%
  glm(vaccination_rate ~ volume_of_hits,
      data = .,
      family = poisson(link = "log")
  )
anova(model1_poissons, test = "Chisq")


plot(model1_log, 1)
plot(model1_poissons, 1)

# Check the distribution of Y variable
Density_Y <- density(us_vaccination_news$vaccination_rate)
plot(Density_Y)

histogram <- us_vaccination_news %>%
  ggplot(aes(x = vaccination_rate)
  ) +
  geom_histogram(fill = "tomato3",
                 bins = 75) # NOT robust

density <- our_merged_dataset %>%
  ggplot(aes(x = cases)
  ) +
  geom_density(fill = "deepskyblue4",
               alpha = 0.25)
'''thanks for your reply, startz. i pasted the rscript above
Most of your code is devoted to organizing the data. To get input on the regression issues you are concerned with, you might think of posting us_vaccination_news so other people can try things. You may find dput() helpful.
tks startz, but , could you be more specific ? 
Something like
dput(us_vaccination_news)
then copy and paste the results here.
As @startz mentioned below it would help if you can make some of your data available. At this moment is genuinely difficult to know what we're working with here.
Just an additional note - you asked about a meaningful correlation. That is different to seeing whether fake news is a good predictor of vaccination rates with the linear regression you want to fit. There are other and related assumptions you need to check if the two variables are linearly correlated or not as well. So just be very specific about what it is you want to test for.
Following along with @GreyMerchant's suggestion, since you have a single right hand side variable you might want to do a scatter plot of vaccination_rate against volume_of_hits to see if it suggests anything about functional form.
thank you, startz and GreyMerchant for your valuable input. allow me to digest your suggestions and get back to you if still unsure.
take care and be safe.
good day, startz and GreyMerchant!
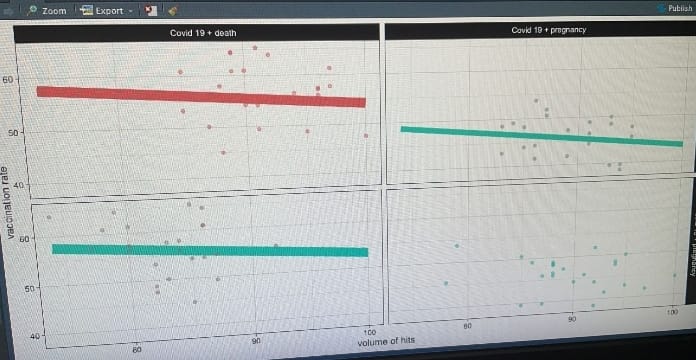
trying to make some progress for the last week or so. now into graphs , particularly using ggplot. hit a bottleneck: 1 of 4 graphs is missing the "curve". this is basically comparing keyword searches versus usa "blue vs red states" . intend to put into graph the attached draft discussion. hope you can help. attaching here 2 jpg shots and ggplot rscript. appreciate your help on this ![]()
covid_state <- ggplot(data = vaccination_select, # raw dataset
                      aes(x = volume_of_hits,
                          y = vaccination_rate))+
  geom_point(aes(color = factor(covid_keyword)),
  alpha = 0.3)+ # this will come from the raw dataset
  geom_line(data = predicted_Y_covid,
            aes(y = predicted_Y,
                color = factor(covid_keyword)),
            size=5)+
  labs(x="volume of hits",
       y="vaccination rate",
       color="covid keyword")+
  geom_point(aes(color = factor(blue_red)
  ),
  alpha = 0.3)+ # this will come from the raw dataset
  geom_line(data = predicted_Y_state,
            aes(y = predicted_Y2,
                color = factor(blue_red)
            ),
            size=3)+
  labs(x="volume of hits",
       y="vaccination rate",
       color="State")+
  #    coord_cartesian(ylim=c(70,100),xlim=c(30,80))+
  facet_grid((covid_keyword~blue_red),
             scales = "free",
             labeller=as_labeller(c("0"="Covid 19 + death","1"="Covid 19 + pregnancy")
             )
  ) +
  theme_linedraw() +
  theme(legend.position = "none")
hi,
i need help, as my project is due very soon.
i'm willing to settle per hour rate for your help. i need to finalize by nov 16 latest 17.
please message me privately if interested. thank you.
i'm willing to settle per hour rate for your help. i need to finalize by nov 16 latest 17.
If you are seeking help in exchange for pay, please post these requests in the gigs post section of RStudio Community. Posting here will increase the visibility of request.
This topic was automatically closed 21 days after the last reply. New replies are no longer allowed.
If you have a query related to it or one of the replies, start a new topic and refer back with a link.