Good evening my colleagues,
How to add the small rectangle as in the following photo.
He selected by the red arrow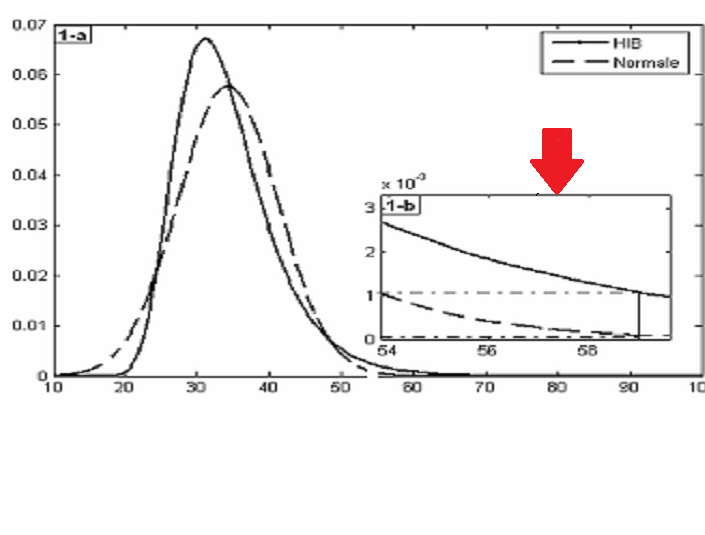
thank you in advance
Good evening my colleagues,
How to add the small rectangle as in the following photo.
He selected by the red arrowHi @Djamely, do you have data you're trying to do this with? Sharing that might make it easier for folks to help you.
Thank you for reply
Yes
install.packages("VGAM", dep=T)
library("VGAM")
x<-seq(-4, 4, length.out=1000)
y.gumbel=dgumbel(x)           #  Loi Gumbel
y.weibull=dweibull(x,shape=1) #  Loi Weibull
y.frechet=dfrechet(x,shape=1) #  Loi Frechet
y<-c(y.gumbel, y.weibull,y.frechet)

GEV<-rep(c("Gumbel","Weibull","Frechet"), each=1000)
data <- data.frame(x=x, y)

library(ggplot2)
p<-ggplot(data, aes(x=x, y=y, color=GEV)) +
  labs(x = "x", y = "")+
  geom_line(lwd=1)+
  ggtitle("GEV")+ labs(title = NULL)
p
It looks like the cowplot package might let you do what you want. The last example of the cowplot vignette seems to be the one that's relevant to you. Maybe you could try it out and return here if you run into issues?
This topic was automatically closed 21 days after the last reply. New replies are no longer allowed.