This question would benefit from being both more specific and more general, as sometimes happens.
For specifics, sufficient data to illustrate the problem would help remove any ambiguity in the framing of the question. The same as is required a reprex (see the FAQ), for suggestions on how to do this. It doesn't have to be all your data or even real data—it just have to have the same structure.
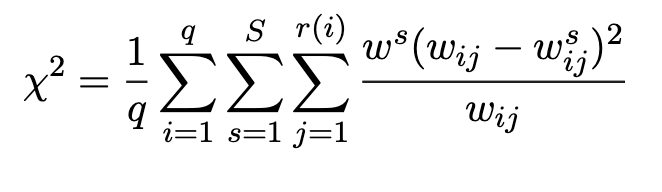
The harder part is articulating the question that the equation is supposed to answer. It might be
do the observed data by categories differ by group more than would be expected by random variation?
This is a moment to reflect on the origins of the R programming language. It was written by statisticians for statisicians and it provides all of the standard textbook statistical tests and many novel statisitical procedures. It would be odd if there wasn't one that covered this case.
chisq.test() seems apt, to compare pairs of groups. And if there are more than two groups, it can be used like this.
# Create a three-column matrix
data_matrix <- matrix(c(10, 20, 30, 40, 50, 60, 70, 80, 90), nrow = 3, ncol = 3)

# Perform pairwise chi-square tests
test_12 <- chisq.test(data_matrix[, 1:2])
test_13 <- chisq.test(data_matrix[, c(1, 3)])
test_23 <- chisq.test(data_matrix[, 2:3])

# Print test results
cat("Test between columns 1 and 2:\n")
#> Test between columns 1 and 2:
print(test_12)
#>
#>  Pearson's Chi-squared test
#>
#> data:  data_matrix[, 1:2]
#> X-squared = 2.8, df = 2, p-value = 0.2466
cat("\nTest between columns 1 and 3:\n")
#>
#> Test between columns 1 and 3:
print(test_13)
#>
#>  Pearson's Chi-squared test
#>
#> data:  data_matrix[, c(1, 3)]
#> X-squared = 4.6875, df = 2, p-value = 0.09597
cat("\nTest between columns 2 and 3:\n")
#>
#> Test between columns 2 and 3:
print(test_23)
#>
#>  Pearson's Chi-squared test
#>
#> data:  data_matrix[, 2:3]
#> X-squared = 0.35455, df = 2, p-value = 0.8376
Created on 2023-09-14 with reprex v2.0.2