Reading dates for plotting

Sorry, this is a simple stupid problem, but then I'm an old guy
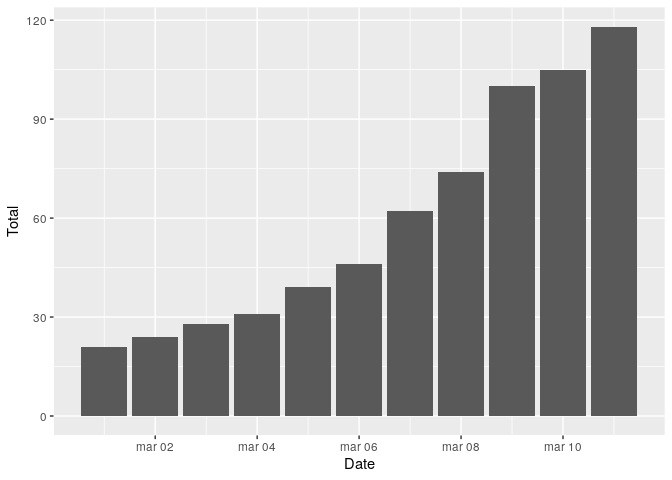
Just trying to plot daily occurrences of coronavirus infections
Have the data as a CSV file, output from Excel, here it is

    Date S.Clara S.Mateo SF Alameda ContraCosta Solano Sacramento S.Cruz Marin Total

1 3/1/2020 7 1 1 1 3 6 1 NA 1 21
2 3/2/2020 9 2 1 1 3 6 1 NA 1 24
3 3/3/2020 11 2 1 2 4 6 1 NA 1 28
4 3/4/2020 14 2 1 2 4 6 1 NA 1 31
5 3/5/2020 20 2 3 2 4 6 1 0 1 39
6 3/6/2020 24 2 2 3 7 6 1 0 1 46
7 3/7/2020 32 2 7 3 7 6 3 1 1 62
8 3/8/2020 37 2 9 3 12 6 3 1 1 74
9 3/9/2020 43 9 14 3 12 6 10 1 2 100
10 3/10/2020 43 9 15 5 13 6 10 2 2 105
11 3/11/2020 48 15 15 5 13 6 10 4 2 118

but when I run
plot(x=BayAreaData$Date,y=BayAreaData$Total,type="h")

it plots the dates in order
3/1/2020
3/11/2020
3/12/2020
3/2/2020
3/3/2020
etc
It is sorting the dates on the first digit
Help

doing something like this might help

BayAreaData$Date <- as.factor(BayAreaData$Date, levels = c(“ 3/1/2020”, “ 3/2/2020”, ...))

Is this what you want to do?

library(tidyverse)
library(lubridate)

BayAreaData <- data.frame(
  stringsAsFactors = FALSE,
              Date = c("3/1/2020","3/2/2020",
                       "3/3/2020","3/4/2020","3/5/2020","3/6/2020","3/7/2020",
                       "3/8/2020","3/9/2020","3/10/2020","3/11/2020"),
           S.Clara = c(7, 9, 11, 14, 20, 24, 32, 37, 43, 43, 48),
           S.Mateo = c(1, 2, 2, 2, 2, 2, 2, 2, 9, 9, 15),
                SF = c(1, 1, 1, 1, 3, 2, 7, 9, 14, 15, 15),
           Alameda = c(1, 1, 2, 2, 2, 3, 3, 3, 3, 5, 5),
       ContraCosta = c(3, 3, 4, 4, 4, 7, 7, 12, 12, 13, 13),
            Solano = c(6, 6, 6, 6, 6, 6, 6, 6, 6, 6, 6),
        Sacramento = c(1, 1, 1, 1, 1, 1, 3, 3, 10, 10, 10),
            S.Cruz = c(NA, NA, NA, NA, 0, 0, 1, 1, 1, 2, 4),
             Marin = c(1, 1, 1, 1, 1, 1, 1, 1, 2, 2, 2),
             Total = c(21, 24, 28, 31, 39, 46, 62, 74, 100, 105, 118)
)

BayAreaData %>% 
    mutate(Date = mdy(Date)) %>% 
    ggplot(aes(x = Date, y = Total)) +
    geom_col()

Created on 2020-03-13 by the reprex package (v0.3.0.9001)

Yes exactly, thanks for help
But is there a way to transform a CSV file so that I don't have to type it all in as you did?
there is going to be a lot more data to try this on

See what happens if you help?
Next I'll want to know how to make it a semilog plot?
and fit and exponential?
Thanks again
Allan

I haven't type it, that is just sample data on a copy/paste friendly format for the sake of reproducibility, you can read your data with the read.csv() function.

Yes I will try, thanks again
I always did want to learn ggplot
The numbers continuing to rise semi-exponentially,
it is going to get worse
Thanks, Allan

You can learn the basics pretty quickly by reading this

This topic was automatically closed 21 days after the last reply. New replies are no longer allowed.