I am trying to solve a liner programming model and have several matrices that feed into it from CSV files. I will use one as an example to explain the problem. It is a logic table showing demand for a particular location where 1 means the location has a demand, 0 means no demand.
This is a test case I put together to see what is happening to my file once read in vs having the data typed in.
I have a csv file that is 7 rows by 13 columns (see below) - just drop that into any txt/csv file.
1,0,0,0,0,0,0,0,0,0,0,0,0
1,0,0,0,0,0,0,0,0,0,0,0,0
1,0,0,0,0,0,0,0,0,0,0,0,0
1,0,0,0,0,0,0,0,0,0,0,0,0
1,0,0,0,0,0,0,0,0,0,0,0,0
1,0,0,0,0,0,0,0,0,0,0,0,0
1,0,0,0,0,0,0,0,0,0,0,0,0
I am using:
DemandFile = read.csv("C:/Dev/R_ProjectFiles/xxx/DataTables/tblDemand.csv", header=FALSE)
Demand_DF <- as.matrix(DemandFile)
that creates a matrix that looks like the matrix on top in the image below
If I type that same thing into the matrix itself:
DemandLoc <- matrix(c(
1,0,0,0,0,0,0,0,0,0,0,0,0,
1,0,0,0,0,0,0,0,0,0,0,0,0,
1,0,0,0,0,0,0,0,0,0,0,0,0,
1,0,0,0,0,0,0,0,0,0,0,0,0,
1,0,0,0,0,0,0,0,0,0,0,0,0,
1,0,0,0,0,0,0,0,0,0,0,0,0,
1,0,0,0,0,0,0,0,0,0,0,0,0),
              ncol=13)
it comes out like this (image on bottom):
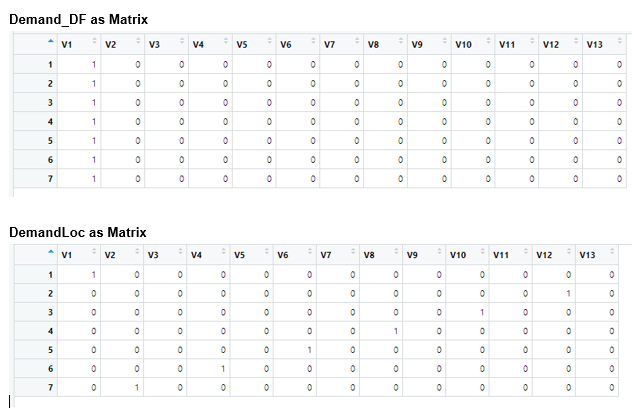
I understand that when I read into a matrix it goes across to fill the column (and thus my ones are not all in the first column like he CSV file) so how can I get a CSV file to act like a Matrix that is "manually" typed in. I need to two to act the same.
I have gone around in circles on this but cannot find a good explanation. Like I said the above is an example, what I need is to get the CSV file to act exactly like the manually typed in version.
BTW, if you cannot tell, this is my first post so pardon if I did not do things correctly. Thanks!