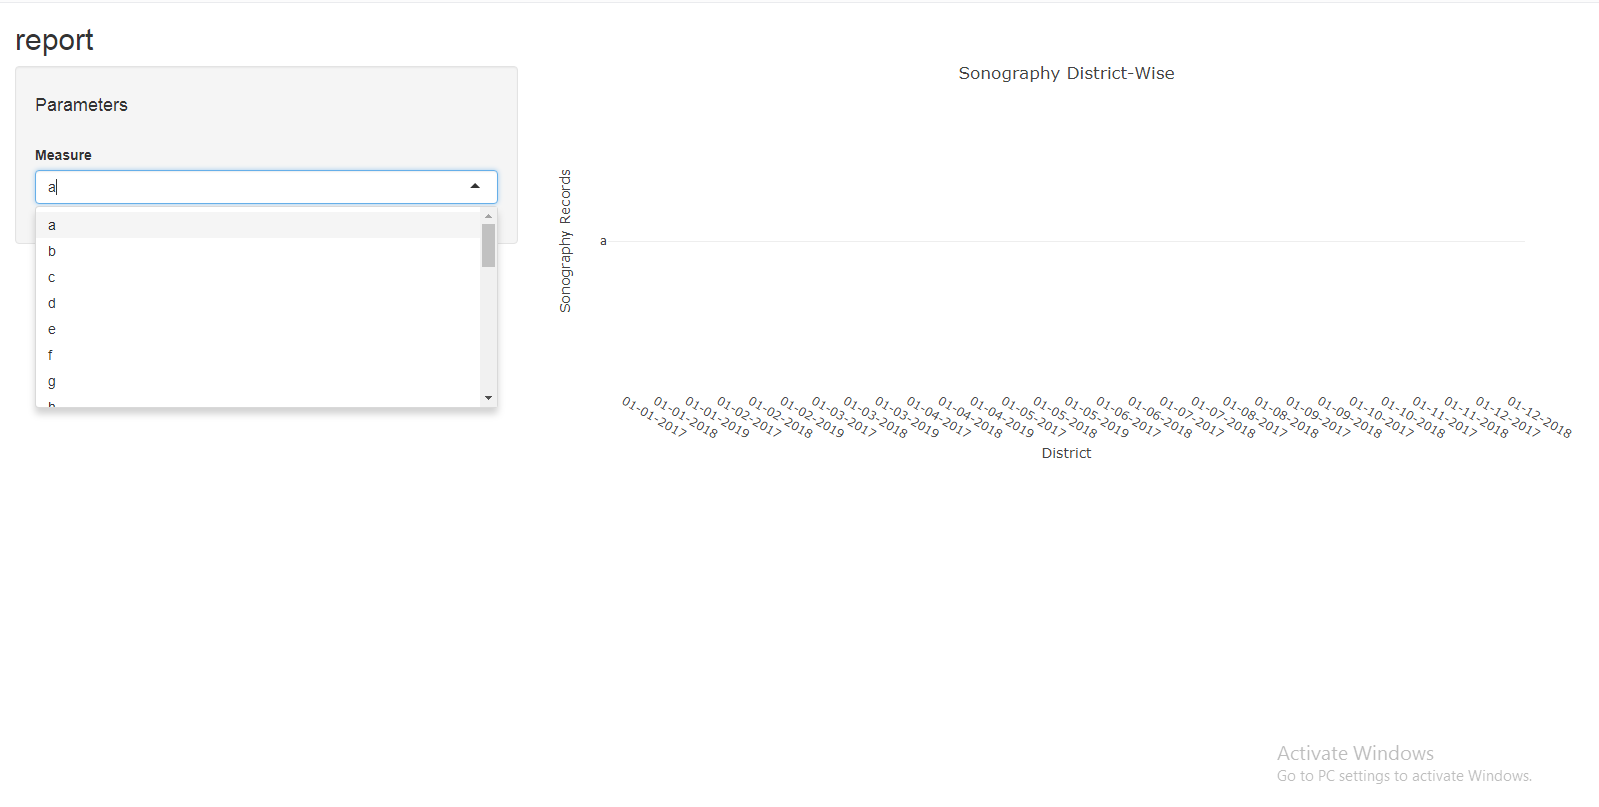
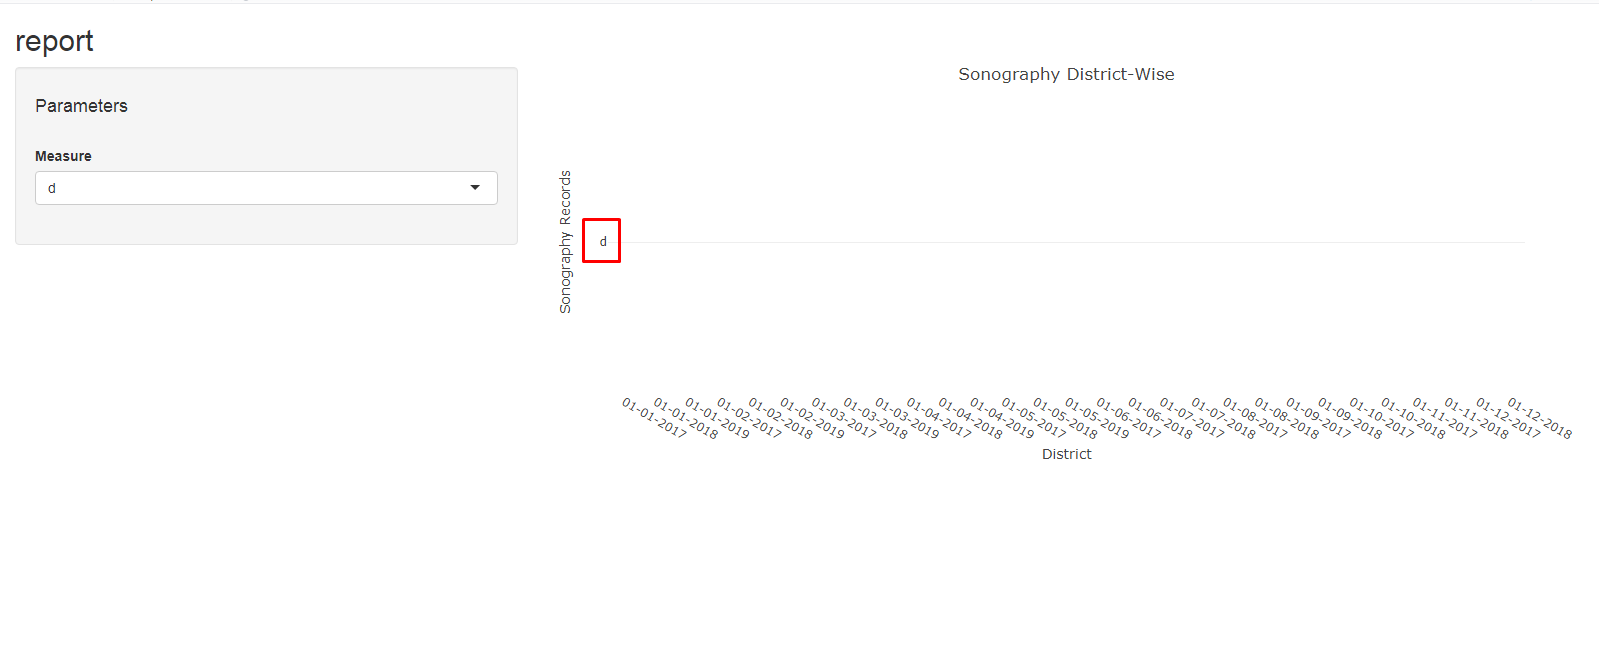
as we can see when we click on select input value it is changing in the graph but why it is not displaying value, I am sure than i am missing something regarding data on the y-axis but don't know what, could someone please guide me through how to rectify this issue.
library(plotly)
library(shiny)
library(ggplot2)

data <- tibble::tribble(
        ~month, ~UnitName, ~abortion, ~delivery, ~pregnant,
  "01-01-2017",       "a",        13,        30,        43,
  "01-02-2017",       "b",        40,        14,        54,
  "01-03-2017",       "c",        19,        15,        34,
  "01-04-2017",       "d",        45,        20,        65,
  "01-05-2017",       "e",        16,        60,        76,
  "01-06-2017",       "f",        10,        35,        45,
  "01-07-2017",       "g",        10,        55,        65,
  "01-08-2017",       "h",        17,        70,        87,
  "01-09-2017",       "i",        10,        88,        98,
  "01-10-2017",       "j",        18,        60,        78,
  "01-11-2017",       "k",        25,        40,        65,
  "01-12-2017",       "l",        30,        37,        67,
  "01-01-2018",       "m",        30,        26,        56,
  "01-02-2018",       "n",        25,        20,        45,
  "01-03-2018",       "o",        20,        14,        34,
  "01-04-2018",       "p",        30,        24,        54,
  "01-05-2018",       "q",        20,        45,        65,
  "01-06-2018",       "r",        10,        57,        67,
  "01-07-2018",       "s",        10,        88,        98,
  "01-08-2018",       "t",        60,        18,        78,
  "01-09-2018",       "u",        30,        35,        65,
  "01-10-2018",       "v",        30,        37,        67,
  "01-11-2018",       "w",        10,        46,        56,
  "01-12-2018",       "x",        20,        45,        65,
  "01-01-2019",       "y",        10,        35,        45,
  "01-02-2019",       "z",        10,        24,        34,
  "01-03-2019",      "aa",        30,        35,        65,
  "01-04-2019",      "bb",        40,        25,        65,
  "01-05-2019",      "cc",        40,        48,        88
  )


ui<-
  fluidPage(
    titlePanel("report"),

  sidebarLayout(
    sidebarPanel(
    h4("Parameters"),
    br(),
    selectInput("Measure", "Measure",data$UnitName)
    ),
    mainPanel(

      plotlyOutput("lineChart"))))

server<-function(input,output){
output$lineChart <- renderPlotly({
# p <- ggplot(data=data, aes_string(x=data$MthYr, y = input$Measure)) +geom_line(size = 1.5) + theme_minimal()
# ggplotly(p)
layout <- list(
      font = list(size = 12),
      title = 'Sonography District-Wise',
      xaxis = list(title = "District"),
      yaxis = list(title = "Sonography Records",automargin = FALSE)
    )


  p <- plot_ly(data, x = data$month, y = input$Measure , type = 'bar') %>%
  layout(font = layout$font, title = layout$title, xaxis = layout$xaxis, yaxis = layout$yaxis)
})
}

shinyApp(ui,server)