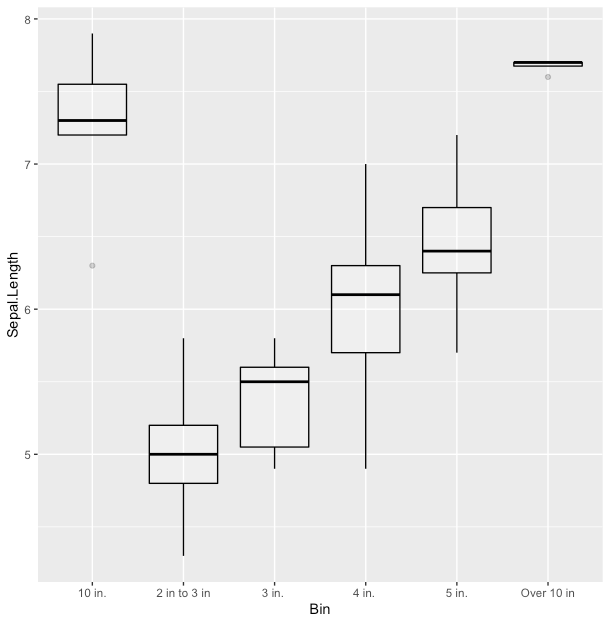
I have a dataframe where I have binned diameters of pipe for plotting into a boxplot. The plot will correctly place the boxes in order except for any diameters at 10 inches, for some reason it will place it first on the x-axis.
I have reproduced the error using the iris dataframe; is there any way to manipulate the plot so that it starts at the smallest diameter, up to 10 and then "over 10 in"?
I have poked around scale_x_discrete put cannot see where I would change the output. I have also tried mutate_if(Bin, is.character, as.factor) to see if changing to a factor would help but it did not.
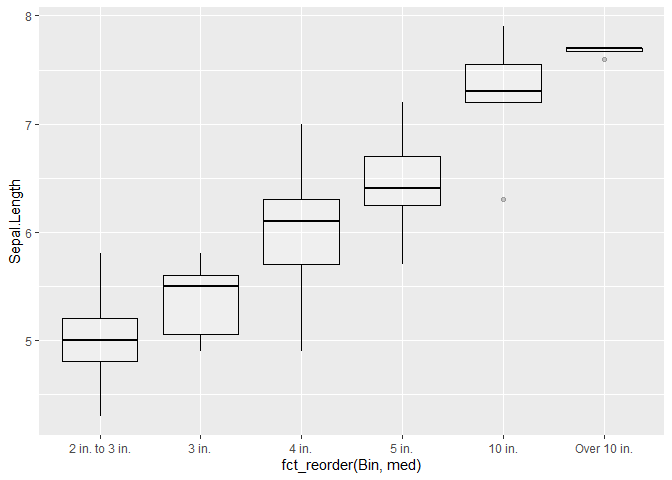
Hi, to order your data you need to turn it into a factor. The simplest way to do this is with the help of the {forcats} package, for example with the function fct_reorder().
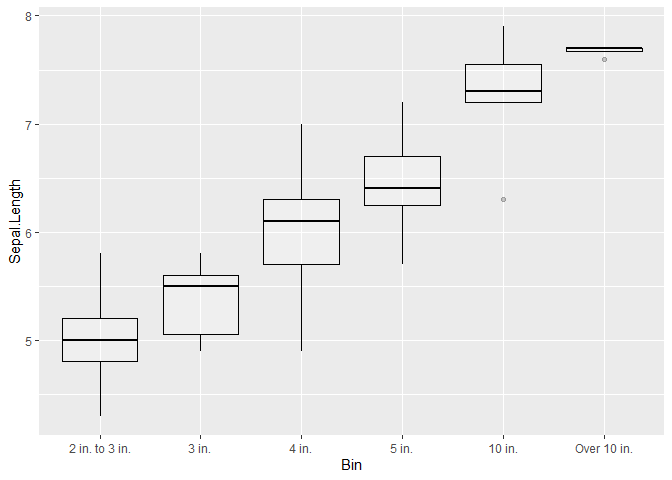
Or you can do it manually (the default is alphabetically):
factor(Bin, levels = c("2 in to 3 in", "3 in.", "4 in.", "5 in.", "10 in.", "Over 10 in")