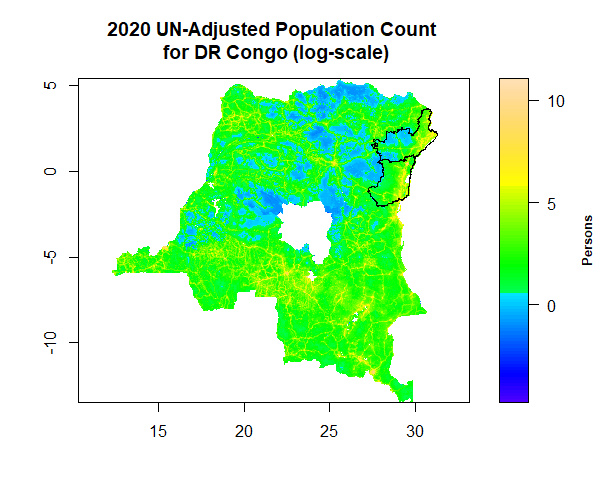
I am using the WorldPop Population Count for DR Congo as a GeoTIFF (.tif) file (See here). This single-band raster file has about 5.17 million grids cells each at the 30-arc second resolution for the entire country.
I would like to clip out just the two northeastern provinces ([Ituri and North-Kivu] in R and save the clipped file as a .tif file. I am able to do this using QGIS (See here) however this is way too complicated. I am looking to using GADM inside the R workspace and overlay it on top of the population count raster and clip out the two provinces.
Here is what I have for my preliminary attempt at importing the raster (.tif) file and the GSDM (.rds) in R.
###########################################################################
#                                                                         #
# Spatial tracking of the 2018-2020 Kivu Ebola outbreak in DRC            #
#                                                                         #
# This source code is issued under the GNU General Public License, v3.0.  #
#                                                                         #
# This script is free software; you can redistribute it and/or modify     #
# it under the terms of the GNU General Public License as published by    #
# the Free Software Foundation; either version 3.0 of the License, or     #
# (at your option) any later version.                                     #
#                                                                         #
# See the GNU General Public License for more details.                    #
#                                                                         #
# https://www.gnu.org/licenses/gpl-3.0.en.html                            #
###########################################################################

rm(list = ls())

#install.packages("raster", dependencies = T)
#install.packages("rgdal", dependencies = T)
#install.packages("ncdf4", dependencies = T)
#install.packages("rstudioapi", dependencies = T)

library(sp)
library(raster)
library(rgdal)
library(ncdf4)
library(rstudioapi)
# library(colorRamps)
# library(ggmap)
# library(ggplot2)

#----------------------------#
# Set your working directory #
#----------------------------#

setwd(dirname(rstudioapi::getActiveDocumentContext()$path)) # RStudio IDE preferred
getwd() # Path to your working directory

#----------------------------------------------------------------#
# Source 1: WorldPop UN-Adjusted Population Count GeoTIFF raster #
#----------------------------------------------------------------#

# Downloaded from https://www.worldpop.org/geodata/summary?id=35845

DRCWorldPop <- raster("cod_ppp_2020_1km_Aggregated_UNadj.tif")

DRCWorldPop # this original raster layer has 2,261 rows and 2,289 columns = 5,175,429 grid cells

dim(DRCWorldPop); length(DRCWorldPop); extent(DRCWorldPop)

names(DRCWorldPop) <- "Susceptible"

names(DRCWorldPop); res(DRCWorldPop); projection(DRCWorldPop)

summary(getValues(DRCWorldPop))

minValue(DRCWorldPop); maxValue(DRCWorldPop)

DRCWorldPop <- replace(DRCWorldPop, is.na(DRCWorldPop), 0)

summary(getValues(DRCWorldPop))

sum(getValues(DRCWorldPop))

nlayers(DRCWorldPop)

#---------------------#
# Source 2: From GADM #
#---------------------#

#?getData
drc <- getData("GADM", level=1, country="COD")
#drc$NAME_1 # List of all provinces

drc <- drc[drc$NAME_1 %in% c("Ituri", "Nord-Kivu"), ]

r <- raster(drc, resolution = res(DRCWorldPop)[1])
values(r) <- 0

r           # this raster layer has 689 rows and 487 columns
extent(r)

plot(log(DRCWorldPop), main = "2020 UN-Adjusted Population Count \n for DR Congo (log-scale)", col=topo.colors(100), legend.width=2, legend.shrink=1, legend.args=list(text='Persons', side=4, font=2, line=2.5, cex=0.8), axes=T)
lines(drc, col="black", lwd=1)

# plot(drc, col = "light yellow")
# lines(drc, col="black", lwd=2)

#--------------------------------------------#
# Merging and Cropping Source 1 and Source 2 #
#--------------------------------------------#

# ?merge

merged <- merge(DRCWorldPop, r, tolerance = 0.07)
# Task: What is the significance of tolerance?

# ?crop
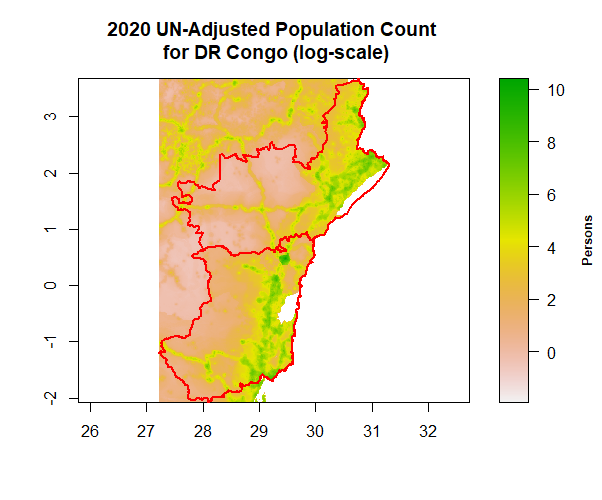
cropped <- crop(merged, drc)
cropped # this raster layer has 689 rows and 487 columns

extent(cropped)

plot(log(cropped), main = "2020 UN-Adjusted Population Count \n for DR Congo (log-scale)", legend.width=2, legend.shrink=1, legend.args=list(text='Persons', side=4, font=2, line=2.5, cex=0.8), axes=T)
lines(drc, col="red", lwd=2)

# Task: How to change the plot Legend to make it more colorful?
# Task: The plot is in log-scale, how to construct a similar colorful plot in raw scale?

writeRaster(cropped, "cropped.tif", format = "GTiff", overwrite = TRUE)

croppedDRCWorldPop <- raster("cropped.tif")

croppedDRCWorldPop # this cropped raster layer has 689 rows and 487 columns

#--------------------------------#
# Aggregating the cropped raster #
#--------------------------------#

aggregationFactor <- 10 # in km

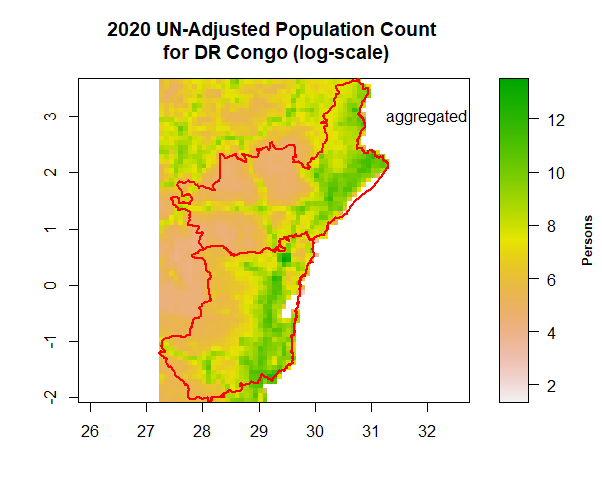
DRC_aggr_count <- aggregate(croppedDRCWorldPop, fact = c(aggregationFactor, aggregationFactor), fun = sum, na.rm = TRUE)

DRC_aggr_count # this raster layer has 69 rows and 49 columns

names(DRC_aggr_count); res(DRC_aggr_count); projection(DRC_aggr_count)
dim(DRC_aggr_count); length(DRC_aggr_count); extent(DRC_aggr_count); isLonLat(DRC_aggr_count)

summary(getValues(DRC_aggr_count))

sum(getValues(DRC_aggr_count))

nrow(DRC_aggr_count)
ncol(DRC_aggr_count)

# ?xyFromCell
#xyFromCell(DRC_aggr_count, 1:ncell(DRC_aggr_count), spatial=FALSE)

# #xy for corners of a raster:
# xyFromCell(DRC_aggr_count, c(1, ncol(DRC_aggr_count), ncell(DRC_aggr_count)-ncol(DRC_aggr_count)+1, ncell(DRC_aggr_count)))
#
# xmin(DRC_aggr_count)
# xmax(DRC_aggr_count)
# ymin(DRC_aggr_count)
# ymax(DRC_aggr_count)

# origin(DRC_aggr_count)

# https://www.nationalgeographic.org/encyclopedia/latitude/

# https://www.nationalgeographic.org/encyclopedia/longitude/

plot(log(DRC_aggr_count), main = "2020 UN-Adjusted Population Count \n for DR Congo (log-scale)", legend.width=2, legend.shrink=1, legend.args=list(text='Persons', side=4, font=2, line=2.5, cex=0.8))
lines(drc, col="red", lwd=2)
text(32,3,"aggregated", xpd = TRUE)

# Task: How to change the plot Legend to make it more colorful?
# Task: The plot is in log-scale, how to construct a similar colorful plot in raw scale?

# library(RColorBrewer)
# warna <- brewer.pal(n = 11, name = "RdYlGn")
# #warna <- rev(warna)
# plot(log(DRC_aggr_count), col=palette(warna), main = "2020 UN-Adjusted Population Count \n for DR Congo (log-scale)", legend.width=2, legend.shrink=1, legend.args=list(text='Persons', side=4, font=2, line=2.5, cex=0.8))
# lines(drc, col="red", lwd=2)
# #plot.window(xlim=extent(DRC_aggr_count)[1:2], ylim=extent(DRC_aggr_count)[3:4])

#spplot(log(DRC_aggr_count))

#-----------------------------------#
# Export cropped raster to a netCDF #
#-----------------------------------#

if (require(ncdf4)) {
  #rnc <- writeRaster(DRCWorldPop, filename ='Congo_full_0000.nc', format = "CDF",  varname = "Susceptible", varunit = "Persons", longname = "Susceptible", overwrite = TRUE)
  rnc_aggr_tif <- writeRaster(DRC_aggr_count, filename ='cod_ppp_2020_10km_Aggregated_UNadj.tif', format = "GTiff",  varname = "Susceptible", varunit = "Persons", longname = "Susceptible", overwrite = TRUE)
  rnc_aggr <- writeRaster(DRC_aggr_count, filename ='Congo_0000.nc', format = "CDF",  varname = "Susceptible", varunit = "Persons", longname = "Susceptible", overwrite = TRUE)
}
I would like the cell values for the neighbouring countries (Uganda, Rwanda, South Sudan, Burundi) set equal to zero. Also the resulting tif has 689 rows and 487 columns which is equivalent to 335,543 nonoverlapping grid cells each containing the population count. This is too big for my simulation purposes so I am aggregating the cropped raster by a factor of 10 to get a raster with 69 rows by 49 columns. Aggregation is done using the above code and finally saved as a NetCDF file and viewed using the Panoply tool. The base NetCDF file has one layer (Population Count data which we call "Susceptible".). To this NetCDF file we add additional epidemic compartments as follows.
#---------------------------------------------------------#
# Adding more epidemic compartments to an existing netCDF #
#---------------------------------------------------------#

episim <- nc_open("Congo_0000.nc", write = TRUE)

episim$dim$latitude$vals;  length(episim$dim$latitude$vals)     # lat is vertical axis  (or)rows in our case
episim$dim$longitude$vals; length(episim$dim$longitude$vals)		# lon is horizontal axis (or) columns in our case

nrows <- length(episim$dim$latitude$vals)
ncols <- length(episim$dim$longitude$vals)

# Longitude is "East - West" means columns
# Latitude is "North - South" means rows

#ncatt_get(episim, 0, attname=NA, verbose=FALSE)

ncatt_put(episim, 0, "created_by", attval = c("Ashok Krishnamurthy"), verbose=FALSE)
ncatt_put(episim, 0, "contact", attval = c("Ashok Krishnamurthy <akrishnamurthy@mtroyal.ca>"), verbose=FALSE)

ncatt_put(episim, 0, "nRows", attval = nrows, verbose=FALSE)
ncatt_put(episim, 0, "nCols", attval = ncols, verbose=FALSE)

#Upper Left Corner pair is (first row, first column) = (27.22375, 3.674584)

ncatt_put(episim, 0, "ULCornerLongitude", attval = episim$dim$longitude$vals[1], verbose=FALSE)
ncatt_put(episim, 0, "ULCornerLatitude", attval = episim$dim$latitude$vals[1], verbose=FALSE)

#Lower Left Corner pair is (last row, first column) = (27.22375, -2.075416)

ncatt_put(episim, 0, "LLCornerLongitude", attval = episim$dim$longitude$vals[1], verbose=FALSE)  #
ncatt_put(episim, 0, "LLCornerLatitude", attval = episim$dim$latitude$vals[nrows], verbose=FALSE) #

#ncatt_put(episim, 0, "cellSize", attval = abs(episim$dim$longitude$vals[1] - episim$dim$longitude$vals[2]), verbose=FALSE)

ncatt_put(episim, 0, "hcellSize", attval = res(DRC_aggr_count)[1], verbose=FALSE)
ncatt_put(episim, 0, "vcellSize", attval = res(DRC_aggr_count)[2], verbose=FALSE)

# episim$var[[1]] # str(episim$var[[1]]$dim) # str(episim$var[[1]])

#----------------------------------------------------------------#
# Adding new Epidemic State Variables to an existing netCDF file #
#----------------------------------------------------------------#

x <- ncdim_def(name = "longitude", units = "degrees_east", vals = episim$dim$longitude$vals, unlim = FALSE, create_dimvar = TRUE, calendar = NA, longname = "longitude")
y <- ncdim_def(name = "latitude",  units = "degrees_north", vals = episim$dim$latitude$vals, unlim = FALSE, create_dimvar = TRUE, calendar = NA, longname = "latitude")

#?ncvar_def
Vaccinated <- ncvar_def(name = "Vaccinated", units = "Persons", dim = list(x,y), missval = NULL, prec = "float", shuffle=FALSE, compression=NA, chunksizes=NA, verbose=FALSE, longname = "Vaccinated")
Exposed   <- ncvar_def(name = "Exposed", units = "Persons", dim = list(x,y), missval = NULL, prec = "float", shuffle=FALSE, compression=NA, chunksizes=NA, verbose=FALSE, longname = "Exposed")
Infected  <- ncvar_def(name = "Infected", units = "Persons", dim = list(x,y), missval = NULL, prec = "float", shuffle=FALSE, compression=NA, chunksizes=NA, verbose=FALSE, longname = "Infected")
Recovered <- ncvar_def(name = "Recovered", units = "Persons", dim = list(x,y), missval = NULL, prec = "float", shuffle=FALSE, compression=NA, chunksizes=NA, verbose=FALSE, longname = "Recovered")
Dead      <- ncvar_def(name = "Dead", units = "Persons", dim = list(x,y), missval = NULL, prec = "float", shuffle=FALSE, compression=NA, chunksizes=NA, verbose=FALSE, longname = "Dead")
Inhabitable <-  ncvar_def(name = "Inhabitable", units = "Binary", dim = list(x,y), missval = NULL, prec = "integer", shuffle=FALSE, compression=NA, chunksizes=NA, verbose=FALSE, longname = "Inhabitable")
#ProvinceIdentifier <-  ncvar_def(name = "ProvinceIdentifier", units = "Province", dim = list(x,y), missval = NULL, prec = "integer", shuffle=FALSE, compression=NA, chunksizes=NA, verbose=FALSE, longname = "ProvinceIdentifier")

# Epidemic State Variables (or Epidemic Compartments) are added in the following order
ncvar_add(episim, Vaccinated)
ncvar_add(episim, Exposed)
ncvar_add(episim, Infected)
ncvar_add(episim, Recovered)
ncvar_add(episim, Dead)
ncvar_add(episim, Inhabitable)
#ncvar_add(episim, ProvinceIdentifier)

currSusceptible <- ncvar_get(episim, episim$var[[2]])     # WorldPop
#ProvinceIdentifier <- ncvar_get(epiProvince, epiProvince$var[[2]]) # Sitansu

dim(currSusceptible)     # 49 rows and 69 columns
dim(t(currSusceptible))  # 69 rows and 49 columns

# sum(currSusceptible)
# sum(currSusceptible>0)
# sum(currSusceptible == 0)
# max(currSusceptible)

# currSusceptible[ncols, nrows]
# currSusceptible[nrows, ncols] # Subscript out of bounds error! AS EXPECTED

# dim(ProvinceIdentifier)
# dim(t(ProvinceIdentifier))
# table(ProvinceIdentifier)

# I could use a combination of transpose and flip from raster package

currVaccinated <- currExposed <- currInfected <- currRecovered  <- currDead <- currInhabitable <- matrix(0, length(episim$dim$longitude$vals),length(episim$dim$latitude$vals))

for(i in 1:ncols)
{ 								# ncols
  for(j in 1:nrows)
  {							  # nrows
    if (currSusceptible[i,j] > 0)
    {
      currInhabitable[i,j] <- 1
    }
    if (currSusceptible[i,j] == 0)
    {
      currInhabitable[i,j] <- 0
    }
  }
}

table(currInhabitable)

# Some cells in DRC have a population count equal to zero. Possibly forests, deserts or uninhabited areas

# currInhabitable
#  0    1
# 903 2478

nc_close(episim)

################################################################################################

episim <- nc_open("Congo_0000.nc", write = TRUE)    # Fill values to an existing ncdf file

ncvar_put(episim, episim$var[[2]], currSusceptible)

ncvar_put(episim, episim$var[[3]], currVaccinated)
ncvar_put(episim, episim$var[[4]], currExposed)
ncvar_put(episim, episim$var[[5]], currInfected)
ncvar_put(episim, episim$var[[6]], currRecovered)
ncvar_put(episim, episim$var[[7]], currDead)
ncvar_put(episim, episim$var[[8]], currInhabitable)
# ncvar_put(episim, episim$var[[9]], ProvinceIdentifier)

cat(paste("The file", episim$filename, "has", episim$nvars, "variables"), fill=TRUE)
for (v in 1:episim$nvars) cat(paste("Variable ", v, " is ", episim$var[[v]]$name,".",sep=""), fill=TRUE)
#episim # class(episim) # str(episim)

nc_close(episim)


