Hi. I am trying to do a radar chart using fmsb. (I know ggplot has a radar option, but I prefer fmsb's visualization.) Everything is fine except the chart is pulling an incorrect value for speed. How can I fix this?
Why is the incorrect value? Speed has three values, equally spaced apart, so I seems 50 could fall on the inner "ring", 70 on the outer, and 60 halfway in between. Could that explain what you see?
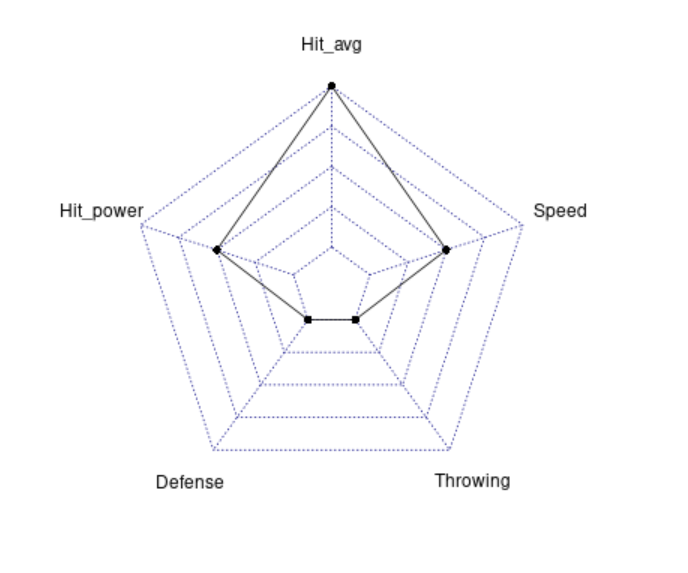
I am plotting player 1's values (Trout). Hit_avg is 80 on outermost ring. Hit_power is 70 on rings two away from Hit_avg. I assume the rings are 5 units from each other. Speed is on the same ring as Hit_power. But Speed should have a value of 60. Shouldn't Speed be on the innermost ring, along with the 60 for Defense and Throwing?
Since a radar chart is for representing data from all columns in table, each column "axis" likely has its own scale, so that the inner ring would be for the minimum values of each of the columns, which may not be equal to each other, and similarly for the outer ring. If so, the value 60 of the Defense column would be on the inner ring and 70 on the outer. But you would have to confirm this is the behavior determined by the definition of the function radarchart(), which I'm not familiar with; it's just behavior that is not inconsistent with the notion of a radar chart.
Dromano, thank you , you are correct. Each axis has its own scale based on the max and min for each feature. I reset max and mins to be the global max and global min, and this resolved my problem.