Hello,
When run, it removed all breaks and and the X-Axis lables. Why doesnt it show since it angle 90 it shouldnt be too long to dispay ?
Sincerely Simon
FJCC
January 30, 2021, 6:27pm
2
The following code works for me. Does it work for you? Are you sure your x values are 1:11?
library(ggplot2)
DF <- data.frame(X=1:11,Y=1:11)
ggplot(DF,aes(X,Y))+geom_point()+
scale_x_continuous(breaks = 1:11,labels = c('20-25 Jahre',
                                            '25-29 Jahre',
                                            '30-34 Jahre',
                                            '35-39 Jahre',
                                            '40-44 Jahre',
                                            '45-49 Jahre',
                                            '50-54 Jahre',
                                            '55-59 Jahre',
                                            '60-64 Jahre',
                                            '65-69 Jahre',
                                            '70 Jahre und älter'))+
  theme(axis.text.x = element_text(angle = 90, vjust = 1, hjust=1))
Thx for the quick answer. Sadly that does not work I will send more of the code:
#Sequenz für X-Achse:

AltersgruppenAllbus<- seq(20,70,5)

#Combine der Durschnittswerte:

DFPTimAltersDurchschnitt <- c(Allbus20mean,Allbus25mean,Allbus30mean,
                              Allbus35mean,Allbus40mean,Allbus45mean,
                              Allbus50mean,Allbus55mean,Allbus60mean,
                              Allbus65mean,Allbus70plusmean)

#Zusammenführung in neuen DataFrame:

AllbusFinal <- data.frame(AltersgruppenAllbus,DFPTimAltersDurchschnitt)
AllbusFinalMelt <- melt(AllbusFinal, id='AltersgruppenAllbus')

#Erstellung der Plots:

ggplot(AllbusFinalMelt,aes(AltersgruppenAllbus,DFPTimAltersDurchschnitt
))+
  geom_line()+
  ylim(0,1600)+
  ylab('Einkommen pro Kopf im Haushalt pro Monat in €')+
    ggtitle("Einkommen pro Kopf im Haushalt pro Monat
  in den Altersgruppen aus vereinfachten Allbus-Auswahl")+
  geom_hline(yintercept=1257)+geom_vline(xintercept = 55)+
  scale_x_continuous(breaks = 1:11,labels = c('20-25 Jahre',
                                              '25-29 Jahre',
                                              '30-34 Jahre',
                                              '35-39 Jahre',
                                              '40-44 Jahre',
                                              '45-49 Jahre',
                                              '50-54 Jahre',
                                              '55-59 Jahre',
                                              '60-64 Jahre',
                                              '65-69 Jahre',
                                              '70 Jahre und älter'))+
  theme(axis.text.x = element_text(angle = 90, vjust = 1, hjust=1))
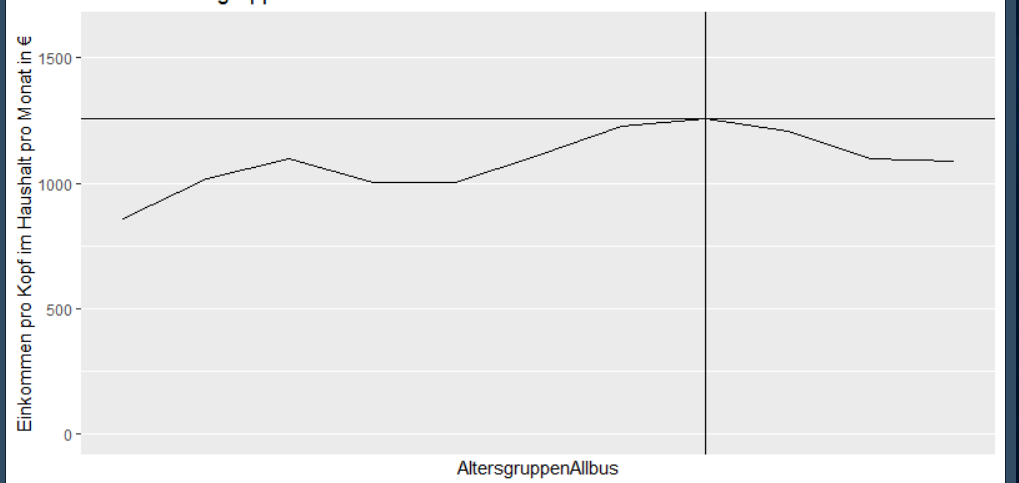
It also does not show any error. That is what the output looks like.
Sincerely Simon
FJCC
January 30, 2021, 6:51pm
4
AltersgruppenAllbus determines the values of the x axis and the values range from 20 to 70.
AltersgruppenAllbus<- seq(20,70,5)
You place your breaks at 1:11. Try setting the breaks at seq(20,70,5).
1 Like
Ok Thx I thought breaks just sets the number of breaks
system
February 6, 2021, 6:55pm
6
This topic was automatically closed 7 days after the last reply. New replies are no longer allowed.