R Shiny reactive selectize highlight input in a plotly plot

Hi to all of you,

I would like to have some help with a problem I have with my shiny app.
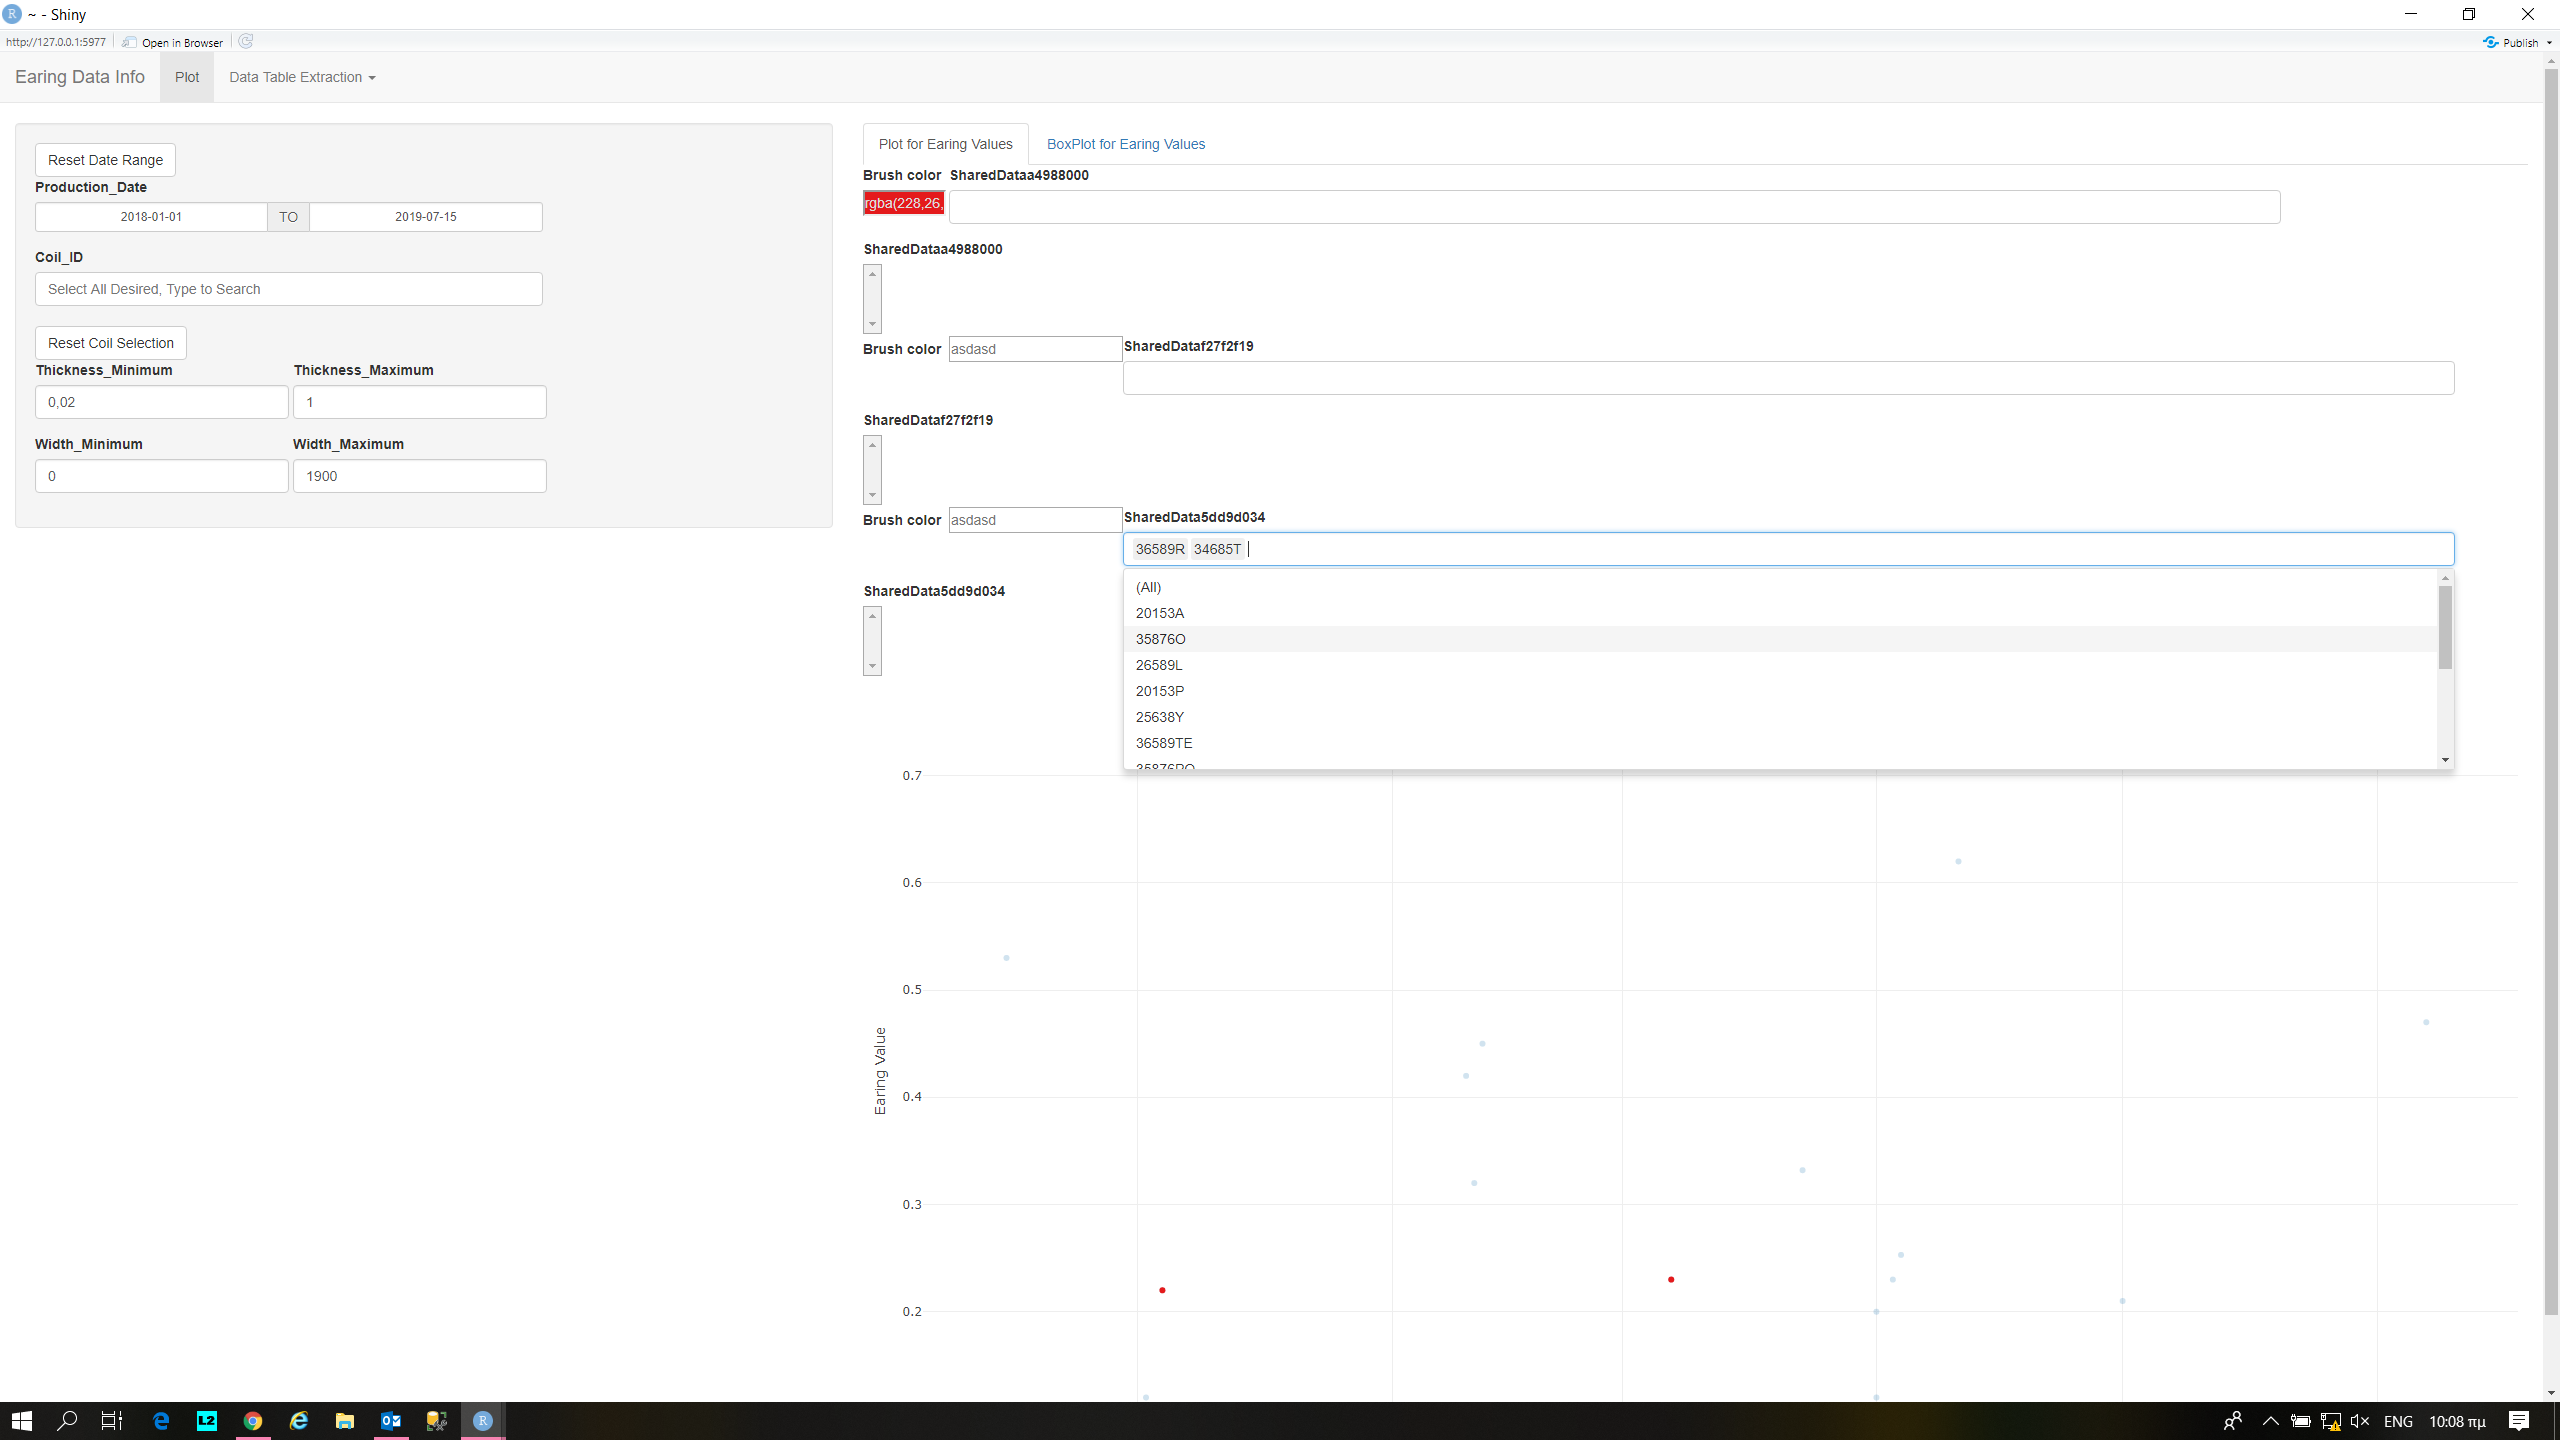
As you can see from the picture below I have a dataset filtered by date, exit_width and exit_thickness.
Also I want to have a highlighter by selecting a Coil_ID I want to see where this or these selections are in my plot.

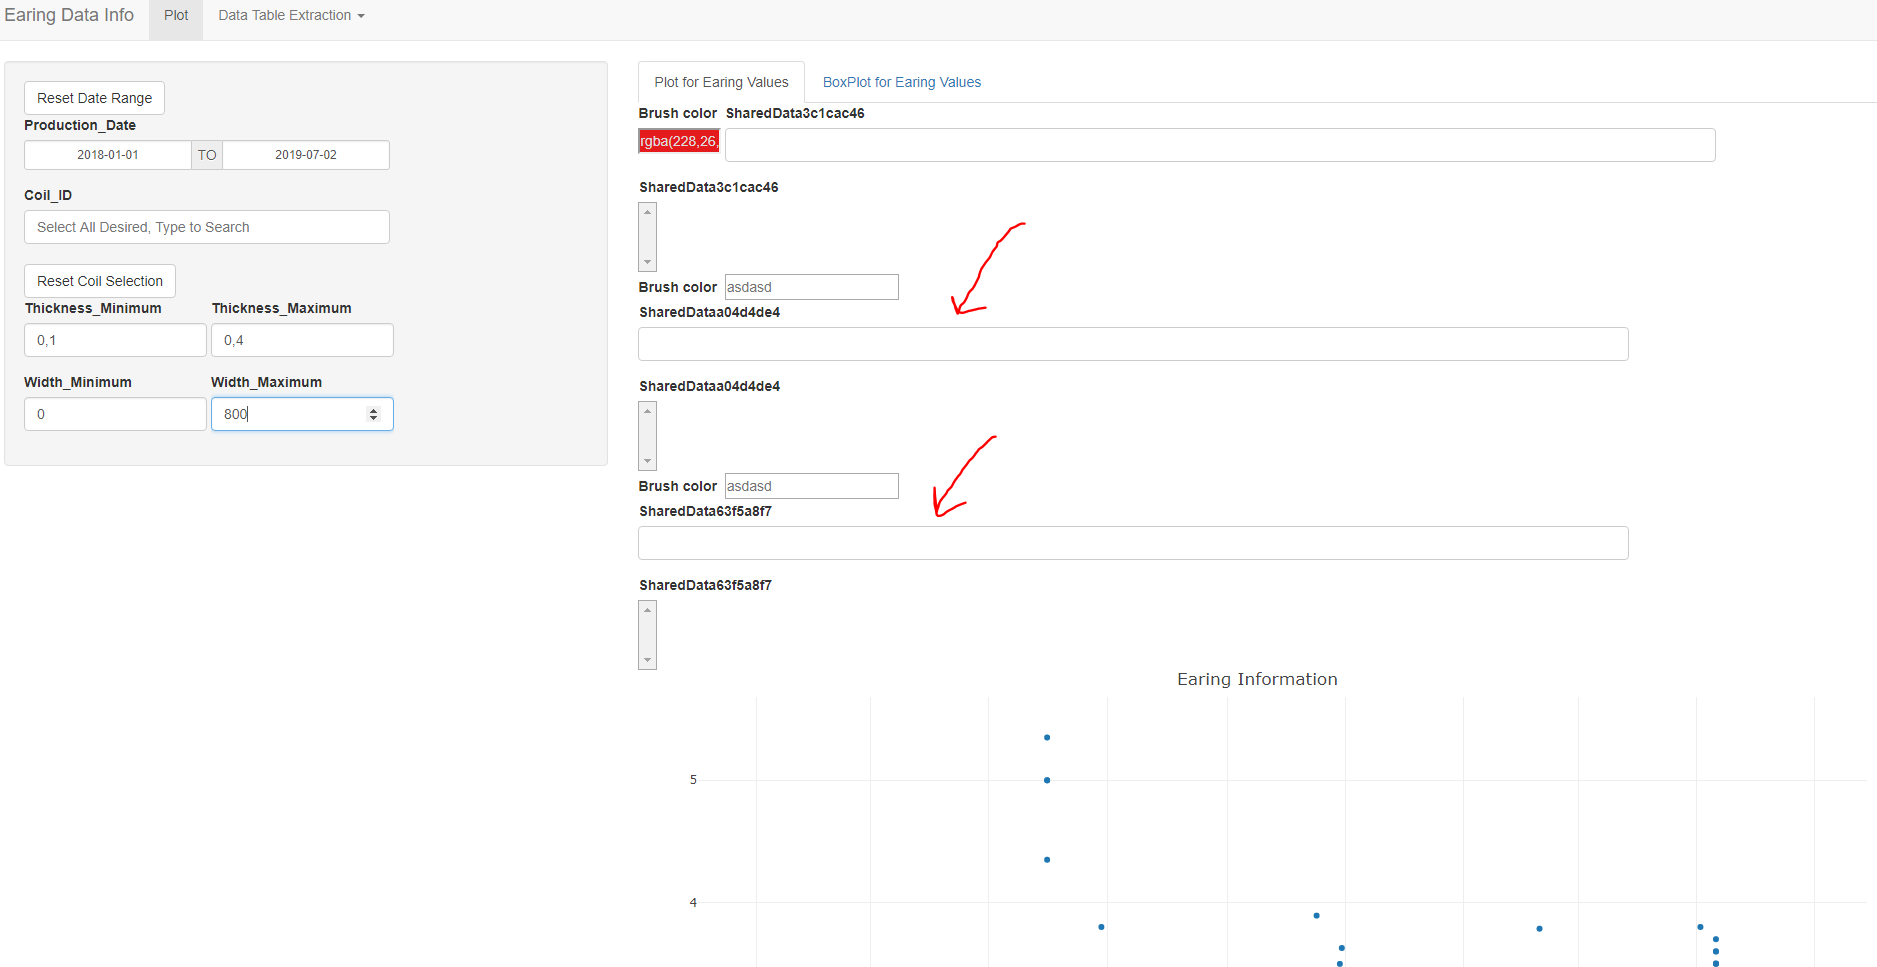
BUT.. when I change a filter a new bar in the brush color - shared data is produced and I have something like the photo below.
Does anyone of you have a thought about this? Why I take this result by filtering my data?

My code is this:

Production_Date <- c('2019-04-01', '2019-03-12', '2019-03-07', '2019-02-11', '2019-01-04', '2019-04-03','2019-04-01', '2018-12-16', '2019-04-04', '2019-03-23', '2019-01-02', '2019-02-24','2019-05-01', '2019-02-12', '2019-06-07', '2019-04-11', '2019-02-10', '2019-06-08')
Coil_ID <- c('20153A', '25638D', '36589R', '35876O', '34685T', '26589L', '20153P', '25638Y', '36589TE', '35876PO', '34685EW', '26589D', '20153ER', '25638A', '36589S', '35876T', '34685LK', '26589MN')
Exit_Width <- c(1304, 1254, 1236, 1536, 1478, 1123, 1111, 1268, 1436, 1256, 1578, 1923, 1804, 1454, 1286, 1586, 1468, 1423)
Earing_Value <- c(0.2, 0.3, 0.23, 0.32, 0.22, 0.23, 0.12, 0.53, 0.253, 0.332, 0.12, 0.30, 0.21, 0.45, 0.47, 0.62, 0.42, 0.73)
Exit_Thickness <- c(0.022, 0.003, 0.023, 0.032, 0.042, 0.323, 0.062, 0.053, 0.123, 0.082, 0.42, 0.373, 0.472, 0.363, 0.153, 0.422, 0.32, 0.365)

EaringData <- data.frame(Production_Date, Coil_ID, Exit_Width, Earing_Value, Exit_Thickness)
EaringData$Production_Date <- as.Date(EaringData$Production_Date)

library(ggplot2)
library(ggthemes)
library(DT)
library(dplyr)
library(dbplyr)
library(DBI)
library(lubridate)
library(shinyalert)

#Server.R

server <- function(session, input, output) {
  
  # Subset data
  selected_trends <- reactive({
    req(input$select_date)
    validate(need(!is.na(input$select_date[1]) & !is.na(input$select_date[2]), "Error: Please provide both a start and an end date."))
    validate(need(input$select_date[1] < input$select_date[2], "Error: Start date should be earlier than end date."))
    EaringData %>%
      filter(
        between(Production_Date, input$select_date[1], input$select_date[2]) &
          between(Exit_Thickness, input$thickness_min, input$thickness_max) &
          between(Exit_Width, input$width_min, input$width_max)
      )
  })
  
  # Reset button for the Date Range Reset 
  observeEvent(
    input$reset, 
    updateDateRangeInput(session, inputId = "select_date", start = "2018-01-01", end = Sys.Date())
  )
  
  # Select Coil_ID
  updateSelectizeInput(session, "coil_id",
                       server = TRUE,
                       choices = sort(unique(EaringData$Coil_ID)),
  )
  
  # Reset button for the Date Range Reset
  observeEvent(
    input$reset_coil,
    updateDateRangeInput(session, inputId = "coil_id")
  )
  
  # Generate Scatter plot with highlight ability.
  output$plot2 <- renderPlotly({
    selected_trends() %>%
      highlight_key(~Coil_ID)%>%
      plot_ly(x = ~Production_Date, y = ~Earing_Value, text = ~Coil_ID, type = "scatter", mode = "markers",  hoverinfo = "x + y + text")%>%
      layout(title = "Earing Information", xaxis = list(title = "Production Date"), yaxis = list(title = "Earing Value"))%>%
      highlight(on = 'plotly_click', off = "plotly_doubleclick", selectize = TRUE, dynamic = TRUE, persistent = TRUE)
  })
  
  
  # Generate boxplot for selected/filtered dataset
  output$plot3 <- renderPlotly({
    selected_trends() %>%
      plot_ly(x = ~Production_Date, y = ~Earing_Value, text = ~Coil_ID, type = "box",  hoverinfo = "x + y + text")%>%
      layout(title = "Earing Information", xaxis = list(title = "Production Date"), yaxis = list(title = "Earing Value"))
  })
  
  
  # Produce the data table 
  output$table_date <- DT::renderDataTable({
    DT::datatable(selected_trends())
  })
  
  # Download the data table which produced in the previous step
  output$downloadData <- downloadHandler(
    filename = 'DataExtraction',
    content = function(file){
      write.csv(selected_trends(),file)
    }
  )
}


# ui.R
library(markdown)
library(shiny)
library(DT)
library(plotly)

ui <- navbarPage("Earing Data Info",
                 # Plot tab
                 tabPanel("Plot",
                          useShinyalert(),
                          sidebarLayout(
                            sidebarPanel(
                              fluidRow(
                                column(8,
                                       
                                       # Reset Date Button
                                       actionButton(inputId = "reset", label = "Reset Date Range"),
                                       
                                       # Select date range to be plotted
                                       dateRangeInput("select_date", strong("Production_Date"), 
                                                      start = "2018-01-01", 
                                                      end = Sys.Date(),
                                                      #min = min(EaringData$Production_Date), 
                                                      #max = max(EaringData$Production_Date), 
                                                      format = "yyyy-mm-dd",
                                                      separator = " TO "),
                                       
                                       # Select Coil_ID
                                       selectizeInput("coil_id", label = strong("Coil_ID"),
                                                      multiple = TRUE,
                                                      choices = NULL,
                                                      options = list(
                                                        placeholder = 'Select All Desired, Type to Search',
                                                        onInitialize = I('function() { this.setValue(""); }')
                                                      )),
                                       
                                       # Reset Coil_ID selection
                                       actionButton(inputId = "reset_coil", label = "Reset Coil Selection"),
                                       
                                       splitLayout(
                                         # Text Input for Thickness
                                         numericInput("thickness_min", "Thickness_Minimum", 0.02, min = 0, max = 2, step = 0.001),
                                         # Text Input for Thickness
                                         numericInput("thickness_max", "Thickness_Maximum", 0.1, min = 0, max = 2, step = 0.001)),
                                       
                                       splitLayout(
                                         # Text Input for Thickness
                                         numericInput("width_min", "Width_Minimum", 0, min = 0, max = 2000, step = 0.001),
                                         
                                         # Text Input for Thickness
                                         numericInput("width_max", "Width_Maximum", 1500, min = 0, max = 2000, step = 0.001))
                                       
                                )
                              )
                            ),
                            
                            # Plot position in app ui
                            mainPanel(
                              tabsetPanel(
                                #tabPanel("Test Plot", plotlyOutput("plot1", height = 800))
                                tabPanel("Plot for Earing Values", plotlyOutput("plot2", height = 800)),
                                tabPanel("BoxPlot for Earing Values", plotlyOutput("plot3", height = 800))
                              )
                            )
                          )
                 ),
                 
                 # Table tab in app ui
                 navbarMenu("Data Table Extraction",
                            tabPanel("Table",
                                     DT::dataTableOutput("table_date"),
                                     downloadButton(outputId = 'downloadData', 'Download Table'))
                 )
                 
)

shinyApp(ui = ui, server = server)

Hi,

Thanks for including all the code, but unfortunately the code is not working as expected producing errors on run and even when fixing them (e.g. Exit_Thickness not defined) I can open the app but the plot is empty.

Please check you sample code so it at least generates the issue as in the screenshot so we can work from there.

PJ

Hi,
Thank you very much for telling me that my sample code had errors.
I edit the code part and now it runs and produces the duplicate bar which I had in the screenshot..
For identify the repeated bar change the Thickness_Maximum in 1 and the Width_Maximum in 1900.
By doing that you will see the "Shared Data" bar 3 times like this:

If you have any idea about this error please let me know about your thoughts.
I would highly appreciate your help.

I have here the code part again:

Production_Date <- c('2019-04-01', '2019-03-12', '2019-03-07', '2019-02-11', '2019-01-04', '2019-04-03','2019-04-01', '2018-12-16', '2019-04-04', '2019-03-23', '2019-01-02', '2019-02-24','2019-05-01', '2019-02-12', '2019-06-07', '2019-04-11', '2019-02-10', '2019-06-08')
Coil_ID <- c('20153A', '25638D', '36589R', '35876O', '34685T', '26589L', '20153P', '25638Y', '36589TE', '35876PO', '34685EW', '26589D', '20153ER', '25638A', '36589S', '35876T', '34685LK', '26589MN')
Exit_Width <- c(1304, 1254, 1236, 1536, 1478, 1123, 1111, 1268, 1436, 1256, 1578, 1923, 1804, 1454, 1286, 1586, 1468, 1423)
Earing_Value <- c(0.2, 0.3, 0.23, 0.32, 0.22, 0.23, 0.12, 0.53, 0.253, 0.332, 0.12, 0.30, 0.21, 0.45, 0.47, 0.62, 0.42, 0.73)
Exit_Thickness <- c(0.022, 0.003, 0.023, 0.032, 0.042, 0.323, 0.062, 0.053, 0.123, 0.082, 0.42, 0.373, 0.472, 0.363, 0.153, 0.422, 0.32, 0.365)

EaringData <- data.frame(Production_Date, Coil_ID, Exit_Width, Earing_Value, Exit_Thickness)
EaringData$Production_Date <- as.Date(EaringData$Production_Date)

library(ggplot2)
library(ggthemes)
library(DT)
library(dplyr)
library(dbplyr)
library(DBI)
library(lubridate)
library(shinyalert)

#Server.R

server <- function(session, input, output) {
  
  # Subset data
  selected_trends <- reactive({
    req(input$select_date)
    validate(need(!is.na(input$select_date[1]) & !is.na(input$select_date[2]), "Error: Please provide both a start and an end date."))
    validate(need(input$select_date[1] < input$select_date[2], "Error: Start date should be earlier than end date."))
    EaringData %>%
      filter(
        between(Production_Date, input$select_date[1], input$select_date[2]) &
          between(Exit_Thickness, input$thickness_min, input$thickness_max) &
          between(Exit_Width, input$width_min, input$width_max)
      )
  })
  
  # Reset button for the Date Range Reset 
  observeEvent(
    input$reset, 
    updateDateRangeInput(session, inputId = "select_date", start = "2018-01-01", end = Sys.Date())
  )
  
  # Select Coil_ID
  updateSelectizeInput(session, "coil_id",
                       server = TRUE,
                       choices = sort(unique(EaringData$Coil_ID)),
  )
  
  # Reset button for the Date Range Reset
  observeEvent(
    input$reset_coil,
    updateDateRangeInput(session, inputId = "coil_id")
  )
  
  # Generate Scatter plot with highlight ability.
  output$plot2 <- renderPlotly({
    selected_trends() %>%
      highlight_key(~Coil_ID)%>%
      plot_ly(x = ~Production_Date, y = ~Earing_Value, text = ~Coil_ID, type = "scatter", mode = "markers",  hoverinfo = "x + y + text")%>%
      layout(title = "Earing Information", xaxis = list(title = "Production Date"), yaxis = list(title = "Earing Value"))%>%
      highlight(on = 'plotly_click', off = "plotly_doubleclick", selectize = TRUE, dynamic = TRUE, persistent = TRUE)
  })
  
  
  # Generate boxplot for selected/filtered dataset
  output$plot3 <- renderPlotly({
    selected_trends() %>%
      plot_ly(x = ~Production_Date, y = ~Earing_Value, text = ~Coil_ID, type = "box",  hoverinfo = "x + y + text")%>%
      layout(title = "Earing Information", xaxis = list(title = "Production Date"), yaxis = list(title = "Earing Value"))
  })
  
  
  # Produce the data table 
  output$table_date <- DT::renderDataTable({
    DT::datatable(selected_trends())
  })
  
  # Download the data table which produced in the previous step
  output$downloadData <- downloadHandler(
    filename = 'DataExtraction',
    content = function(file){
      write.csv(selected_trends(),file)
    }
  )
}


# ui.R
library(markdown)
library(shiny)
library(DT)
library(plotly)

ui <- navbarPage("Earing Data Info",
                 # Plot tab
                 tabPanel("Plot",
                          useShinyalert(),
                          sidebarLayout(
                            sidebarPanel(
                              fluidRow(
                                column(8,
                                       
                                       # Reset Date Button
                                       actionButton(inputId = "reset", label = "Reset Date Range"),
                                       
                                       # Select date range to be plotted
                                       dateRangeInput("select_date", strong("Production_Date"), 
                                                      start = "2018-01-01", 
                                                      end = Sys.Date(),
                                                      #min = min(EaringData$Production_Date), 
                                                      #max = max(EaringData$Production_Date), 
                                                      format = "yyyy-mm-dd",
                                                      separator = " TO "),
                                       
                                       # Select Coil_ID
                                       selectizeInput("coil_id", label = strong("Coil_ID"),
                                                      multiple = TRUE,
                                                      choices = NULL,
                                                      options = list(
                                                        placeholder = 'Select All Desired, Type to Search',
                                                        onInitialize = I('function() { this.setValue(""); }')
                                                      )),
                                       
                                       # Reset Coil_ID selection
                                       actionButton(inputId = "reset_coil", label = "Reset Coil Selection"),
                                       
                                       splitLayout(
                                         # Text Input for Thickness
                                         numericInput("thickness_min", "Thickness_Minimum", 0.02, min = 0, max = 2, step = 0.001),
                                         # Text Input for Thickness
                                         numericInput("thickness_max", "Thickness_Maximum", 0.1, min = 0, max = 2, step = 0.001)),
                                       
                                       splitLayout(
                                         # Text Input for Thickness
                                         numericInput("width_min", "Width_Minimum", 0, min = 0, max = 2000, step = 0.001),
                                         
                                         # Text Input for Thickness
                                         numericInput("width_max", "Width_Maximum", 1500, min = 0, max = 2000, step = 0.001))
                                       
                                )
                              )
                            ),
                            
                            # Plot position in app ui
                            mainPanel(
                              tabsetPanel(
                                #tabPanel("Test Plot", plotlyOutput("plot1", height = 800))
                                tabPanel("Plot for Earing Values", plotlyOutput("plot2", height = 800)),
                                tabPanel("BoxPlot for Earing Values", plotlyOutput("plot3", height = 800))
                              )
                            )
                          )
                 ),
                 
                 # Table tab in app ui
                 navbarMenu("Data Table Extraction",
                            tabPanel("Table",
                                     DT::dataTableOutput("table_date"),
                                     downloadButton(outputId = 'downloadData', 'Download Table'))
                 )
                 
)

shinyApp(ui = ui, server = server)

This looks like a bug in plotly. I've filed an issue here -- https://github.com/ropensci/plotly/issues/1584

If you need a workaround in the meantime, you can use event_data("plotly_click") instead of highlight_key()/highlight() to achieve similar interactive functionality (for an example, see https://plotly-r.com/linking-views-with-shiny.html#fig:plotlyEvents

1 Like

Thank you very much!
I really appreciate your answers and your time spending in my problem!
Have a nice day!

This topic was automatically closed 54 days after the last reply. New replies are no longer allowed.