I would like to use leaflet to make a map of Virginia with county boundaries. Can I use the upmaps package in anyway? Or do I have to use a shapefile. Does anyone have any ideas. I just started learning R, and am not sure how to do this.
I am also wondering if there is a way to layer the usmaps package on leaflet
I suggest you base your map on county boundaries from the {tigris} package. It is easy to use and rather popular.
Your app with a reactive map might look kind of like this:
library(shiny)
library(leaflet)
library(sf)
# VA counties - downloaded via the awesome tigris package
shape <- tigris::counties(state = "VA", class = "sf")
# Define UI
ui <- fluidPage(
# Application title
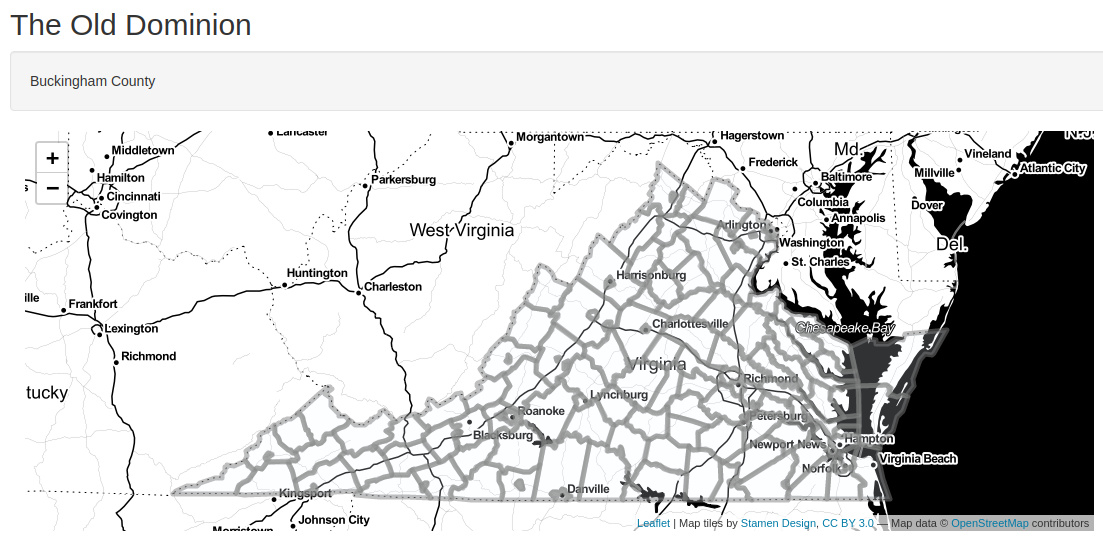
titlePanel("The Old Dominion"),
# Top panel with county name
verticalLayout(
wellPanel(textOutput("cnty")),
# the map itself
mainPanel(
leafletOutput("map")
)
)
)
# Define server logic
server <- function(input, output) {
output$map <- renderLeaflet({
leaflet() %>%
addProviderTiles("Stamen.Toner") %>%
addPolygons(data = shape,
fillColor = "aliceblue",
color = "grey",
layerId = ~COUNTYNS)
})
# this is the fun part!
observe({
event <- input$map_shape_click
output$cnty <- renderText(shape$NAMELSAD[shape$COUNTYNS == event$id])
})
}
# Run the application
shinyApp(ui = ui, server = server)
I am using reactivity to display the county name on top (by reading the id of clicked polygon - it has to be assigned to layerId argument of the leaflet call; once a polygon is clicked it is in input$map_shape_click$id field).
Thank you so much, I will try that
1 Like
This topic was automatically closed 21 days after the last reply. New replies are no longer allowed.