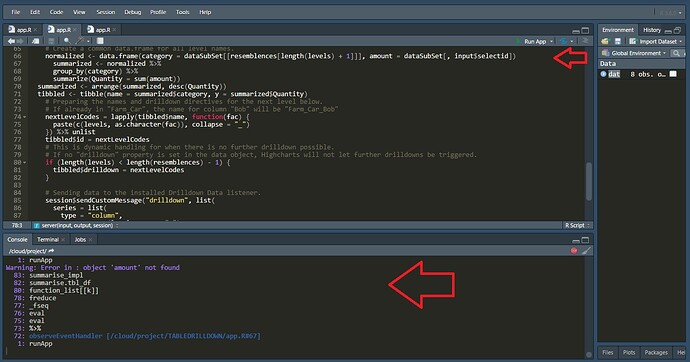
I am trying to create a drill down chart using highcharts package, the chart must be dependent on the selectinput results.
The current error is
Error in .getReactiveEnvironment()$currentContext() :
Operation not allowed without an active reactive context. (You tried to do something that can only be done from inside a reactive expression or observer.)
the expected or desired output is to get dynamic plot depending on the selected value.
library (shinyjs)
library (tidyr)
library (data.table)
library (highcharter)
library (dplyr)
library (shinydashboard)
library (shiny)

x <- c("Farm","Farm","Farm","City","City","City","Ocean","Ocean")
y <- c("Sheep","Sheep","Cow","Car","Bus","Bus","Boat","Boat")
z <- c("Bill","Tracy","Sandy","Bob","Carl","Newt","Fig","Tony")
a <- c(1,1,1,1,1,1,1,1)
b <- c(3,2,5,1,3,5,1,5)
c <- c(4,6,7,7,4,2,1,6)

header <- dashboardHeader()
body <- dashboardBody(
selectInput("selectid","Select a Measurement",choices=c("a","b","c"),selected = "a"),
highchartOutput("Working"))
sidebar <- dashboardSidebar()
ui <- dashboardPage(header, sidebar, body)

server <- function(input, output, session) {
zzz<-reactive({
    select(xxxx,x,y,z,input$selectid)})
print(zzz())
output$Working <- renderHighchart({
    # Make the initial data.
    summarized <- zzz() %>%
        group_by(x) %>%
        summarize(Quantity = sum(input$selectid))

    summarized <- arrange(summarized, desc(Quantity))
    tibbled <- tibble(name = summarized$x, y = summarized$Quantity)

    # This time, click handler is needed.
    drilldownHandler <- JS("function(event) {Shiny.onInputChange('ClickedInput', event.point.drilldown);}")

    installDrilldownReceiver <- JS("function() {
  var chart = this;
  Shiny.addCustomMessageHandler('drilldown', function(message) {
    var point = chart.get(message.point)
    chart.addSeriesAsDrilldown(point, message.series);
  });
}")

    highchart() %>%
        hc_chart(events = list(load = installDrilldownReceiver, drilldown = drilldownHandler)) %>%
        hc_xAxis(type = "category") %>%
        hc_add_series(tibbled, "column", hcaes(x = name, y = y, drilldown = name, id = name), color = "#E4551F") %>%
        hc_plotOptions(column = list(stacking = "normal")) %>%
        hc_drilldown(allowPointDrilldown = TRUE)
})

observeEvent(input$ClickedInput, {
    levels <- strsplit(input$ClickedInput, "_", fixed = TRUE)[[1]]
    resemblences <- c("x", "y", "z")
    dataSubSet <- reactive({
        #browser()
        zzz()
    })
    for (i in 1:length(levels)) {
        dataSubSet() <- zzz()[zzz()[[resemblences[i]]] == levels[i],]
    }

    normalized <- data.frame(category = dataSubSet()[[resemblences[length(levels) + 1]]], amount = input$selectid)

    summarized <- normalized %>%
        group_by(category) %>%
        summarize(Quantity = sum(amount))

    summarized <- arrange(summarized, desc(Quantity))

    tibbled <- tibble(name = summarized$category, y = summarized$Quantity)

    nextLevelCodes = lapply(tibbled$name, function(fac) {
        paste(c(levels, as.character(fac)), collapse = "_")
    }) %>% unlist

    tibbled$id = nextLevelCodes

    if (length(levels) < length(resemblences) - 1) {
        tibbled$drilldown = nextLevelCodes
    }

    session$sendCustomMessage("drilldown", list(
        series = list(
            type = "column",
            name = paste(levels, sep = "_"),
            data = list_parse(tibbled)
        ),
        point = input$ClickedInput
    ))
})

output$trial <- renderText({input$ClickedInput})
}
shinyApp(ui, server)