R shiny fileInput and render DT

First of all, I thank you very much for watching my question

Please take a look at a dynamic diagram first
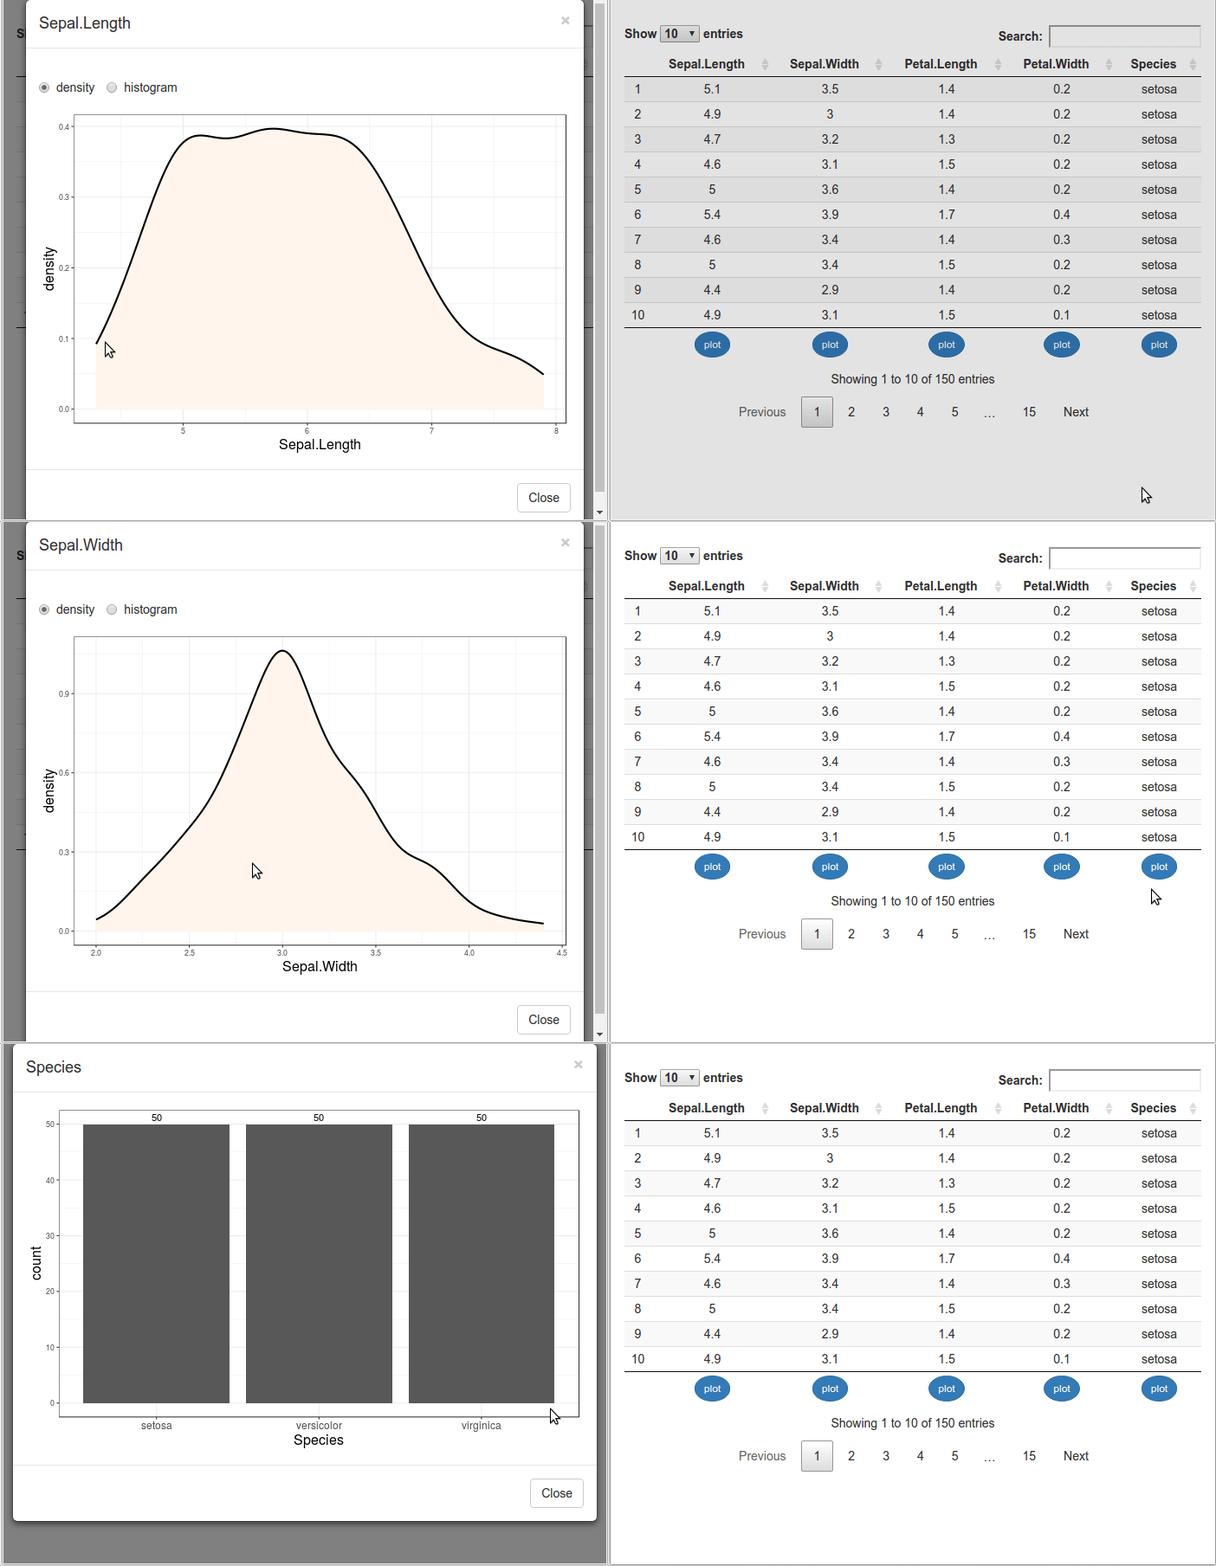
The following is the corresponding code:

library(shiny)
library(shinyBS)
library(DT)
library(ggplot2)

ui <- fluidPage(
  uiOutput("modals"),
  DTOutput("table")
)

server <- function(input, output, session){

  dat <- iris

  buttons <- lapply(1:ncol(dat), function(i){
    actionButton(
      paste0("this_id_is_not_used",i),
      "plot",
      class = "btn-primary btn-sm",
      style = "border-radius: 50%;", 
      onclick = sprintf(
        "Shiny.setInputValue('button', %d, {priority:'event'});
        $('#modal%d').modal('show');", i, i)
    )
  })
  
  output[["table"]] <- renderDT({
    sketch <- tags$table(
      class = "row-border stripe hover compact",
      tableHeader(c("", names(dat))),
      tableFooter(c("", buttons))
    )
    datatable(
      dat, container = sketch, 
      options = 
        list(
          columnDefs = list(
            list(
              className = "dt-center",
              targets = "_all"
            )
          )
        )
    )
  })

  # modals ####
  output[["modals"]] <- renderUI({
    lapply(1:ncol(dat), function(i){
      bsModal(
        id = paste0("modal",i),
        title = names(dat)[i],
        trigger = paste0("this_is_not_used",i),
        if(is.numeric(dat[[i]]) && length(unique(dat[[i]]))>19){
          fluidRow(
            column(5, radioButtons(paste0("radio",i), "",
                       c("density", "histogram"), inline = TRUE)),
            column(7,
                   conditionalPanel(
                     condition = sprintf("input.radio%d=='histogram'",i),
                     sliderInput(paste0("slider",i), "Number of bins",
                                 min = 5, max = 100, value = 30)
                   ))
          )
        },
        plotOutput(paste0("plot",i))
      )
    })
  })
  
  # plots in modals ####
  for(i in 1:ncol(dat)){
    local({
      ii <- i
      output[[paste0("plot",ii)]] <- renderPlot({
        if(is.numeric(dat[[ii]]) && length(unique(dat[[ii]]))>19){
          if(input[[paste0("radio",ii)]] == "density"){
            ggplot(dat, aes_string(names(dat)[ii])) + 
              geom_density(fill = "seashell", color = "seashell") + 
              stat_density(geom = "line", size = 1) + 
              theme_bw() + theme(axis.title = element_text(size = 16))
          }else{
            ggplot(dat, aes_string(names(dat)[ii])) + 
              geom_histogram(bins = input[[paste0("slider",ii)]]) + 
              theme_bw() + theme(axis.title = element_text(size = 16))
          }
        }else{
          dat[[".x"]] <- 
            factor(dat[[ii]], levels = names(sort(table(dat[[ii]]), 
                                                 decreasing=TRUE)))
          gg <- ggplot(dat, aes(.x)) + geom_bar() + 
            geom_text(stat="count", aes(label=..count..), vjust=-0.5) + 
            xlab(names(dat)[ii]) + theme_bw()
          if(max(nchar(levels(dat$.x)))*nlevels(dat$.x)>40){
            gg <- gg + theme(axis.text.x = 
                               element_text(size = 12, angle = 45, 
                                            vjust = 0.5, hjust = 0.5))
          }else{
            gg <- gg + theme(axis.text.x = element_text(size = 12))
          }
          gg + theme(axis.title = element_text(size = 16))
        }
      })
    })
  }
  
}

shinyApp(ui, server)

My goal is to make an rshiny to replace the iris data above with the data uploaded by the user himself. Here, I use rshiny's fileinput. The following is the code

ui <- fluidPage(
  fileInput("upload", NULL, accept = c(".csv", ".tsv")),
)

server <- function(input, output, session) {
  data <- reactive({
    req(input$upload)
    
    ext <- tools::file_ext(input$upload$name)
    switch(ext,
           csv = vroom::vroom(input$upload$datapath, delim = ","),
           tsv = vroom::vroom(input$upload$datapath, delim = "\t"),
           validate("Invalid file; Please upload a .csv or .tsv file")
          )
    
  })

}
  
shinyApp(ui, server)

I have tried two methods, one is to name the data uploaded by the user DAT and replace it directly, and the other is to change the following dat to dat () after the user uploads the data, but all of them report errors. If anyone can help me solve this problem, I will be grateful

Hi there, your intuition of substituting the user-supplied data for dat and changing to dat() was on point. I think the errors you may have been receiving after attempting this were due to downstream code (e.g. the "buttons" object and modal plots) expecting a non-reactive object. To remedy this, you need to use observe to listen for those dat() changes.
Secondly, I think this use case is a great candidate for a module. In fact, that link has an example where the user is required to input a valid file via fileInput. Therefore, I have taken your second code chunk and converted into a module. Couple that with small changes to deal with newly introduced reactivity, you should have what was desired. Please take a look at the code below. Note: I did move the validate statement into the renderDT chunk and included need, since keeping it in the module produced unexpected results.

library(shiny)
library(shinyBS)
library(DT)
library(ggplot2)
library(vroom)

# Module----
fileInputModule_UI <- function(id) {
  ns <- NS(id)
  tagList(
    fileInput(ns("upload"), "Upload your CSV/TSV", accept = c(".csv", ".tsv"))
  )
}

fileInputModule <- function(id) {
  moduleServer(
    id, 
    function(input, output, session) {
      data <- reactive({
        req(input$upload)
        ext <- tools::file_ext(input$upload$name)
        switch(ext,
               csv = vroom::vroom(input$upload$datapath, delim = ","),
               tsv = vroom::vroom(input$upload$datapath, delim = "\t")
               # validate("Invalid file; Please upload a .csv or .tsv file")
        )
      })
      return(data)
    }
    
  )
  
}

# App----
ui <- fluidPage(
  fileInputModule_UI("datafile"),
  uiOutput("modals"),
  DTOutput("table")
)

server <- function(input, output, session){
  
  dat <- fileInputModule("datafile")
  
  buttons <- reactive({
    req(dat())
    dat <- dat() # Assign local 'dat' from reactive to keep your code intact
    lapply(1:ncol(dat), function(i){
      actionButton(
        paste0("this_id_is_not_used",i),
        "plot",
        class = "btn-primary btn-sm",
        style = "border-radius: 50%;", 
        onclick = sprintf(
          "Shiny.setInputValue('button', %d, {priority:'event'});
        $('#modal%d').modal('show');", i, i)
      )
    })
  })
  
  output[["table"]] <- renderDT({
    validate(
      need(!is.null(dat()), "Invalid file; Please upload a .csv or .tsv file")
    )
    req(dat(), buttons())
    dat <- dat() # Assign local 'dat' from reactive to keep your code intact
    sketch <- tags$table(
      class = "row-border stripe hover compact",
      tableHeader(c("", colnames(dat))),
      tableFooter(c("", buttons()))
    )
    datatable(
      dat, container = sketch, 
      options = 
        list(
          columnDefs = list(
            list(
              className = "dt-center",
              targets = "_all"
            )
          )
        )
    )
  })
  
  # modals ####
  output[["modals"]] <- renderUI({
    req(dat())
    dat <- dat() # Assign local 'dat' from reactive to keep your code intact
    lapply(1:ncol(dat), function(i){
      bsModal(
        id = paste0("modal",i),
        title = colnames(dat)[i],
        trigger = paste0("this_is_not_used",i),
        if(is.numeric(dat[[i]]) && length(unique(dat[[i]]))>19){
          fluidRow(
            column(5, radioButtons(paste0("radio",i), "",
                                   c("density", "histogram"), inline = TRUE)),
            column(7,
                   conditionalPanel(
                     condition = sprintf("input.radio%d=='histogram'",i),
                     sliderInput(paste0("slider",i), "Number of bins",
                                 min = 5, max = 100, value = 30)
                   ))
          )
        },
        plotOutput(paste0("plot",i))
      )
    })
  })
  
  # plots in modals ####
  observe({
    req(dat())
    dat <- dat() # Assign local 'dat' from reactive to keep your code intact
    for(i in 1:ncol(dat)){
      local({
        ii <- i
        output[[paste0("plot",ii)]] <- renderPlot({
          if(is.numeric(dat[[ii]]) && length(unique(dat[[ii]]))>19){
            if(input[[paste0("radio",ii)]] == "density"){
              ggplot(dat, aes_string(colnames(dat)[ii])) + 
                geom_density(fill = "seashell", color = "seashell") + 
                stat_density(geom = "line", size = 1) + 
                theme_bw() + theme(axis.title = element_text(size = 16))
            }else{
              ggplot(dat, aes_string(colnames(dat)[ii])) + 
                geom_histogram(bins = input[[paste0("slider",ii)]]) + 
                theme_bw() + theme(axis.title = element_text(size = 16))
            }
          }else{
            dat[[".x"]] <- 
              factor(dat[[ii]], levels = names(sort(table(dat[[ii]]), 
                                                    decreasing=TRUE)))
            gg <- ggplot(dat, aes(.x)) + geom_bar() + 
              geom_text(stat="count", aes(label=..count..), vjust=-0.5) + 
              xlab(names(dat)[ii]) + theme_bw()
            if(max(nchar(levels(dat$.x)))*nlevels(dat$.x)>40){
              gg <- gg + theme(axis.text.x = 
                                 element_text(size = 12, angle = 45, 
                                              vjust = 0.5, hjust = 0.5))
            }else{
              gg <- gg + theme(axis.text.x = element_text(size = 12))
            }
            gg + theme(axis.title = element_text(size = 16))
          }
        })
      })
    }
  })
  
  
}

shinyApp(ui, server)
1 Like

Actually, I have one question confused me, why we need to use
ns <- NS(id)
to create different ID?

Thank you very much for your help. Words can't express my gratitude. You not only solved my problems, but also let me learn new knowledge. I believe I can solve similar problems in the future. Thank you very much for your dedication. Thank you

BY the way , I thought of a solution before,
use directly

###data is uploaded
dat <- data()

but the system told me that there was an environmental problem

This topic was automatically closed 7 days after the last reply. New replies are no longer allowed.

If you have a query related to it or one of the replies, start a new topic and refer back with a link.